1. INTRODUCTION
The demand for wood products is expected to increase to achieve carbon neutrality by 2050. This is because wood-based products are the only materials recognized by the United Nations Framework Convention on Climate Change (UNFCCC) as having a carbon storage capacity (Choi et al., 2010; Son et al., 2014). Chun et al. (2021) reported that the amount of carbon dioxide stored in 1 m of structural lumber is approximately 840 tons. Therefore, the demand for wood products is expected to increase as climate change becomes a global priority.
One of the most effective ways to use wood-based products in terms of carbon neutrality is to use them as structural materials for wooden buildings (Kim et al., 2024; Won et al., 2024). The use of domestic wood as a structural material can enhance the carbon storage effect by extending its service life. Son et al. (2014) concluded that wood-based products with a service life of 50 years could be used as civil structural materials. The half-lives of different wood-based products, a key indicator of product lifespan, have been reported to be 35, 30, 20, and two years for lumber, structural panels, nonstructural panels, and paper, respectively (IPCC, 2006). On the other hand, wood-based products used for building interior materials were reported to have a lifespan that is 1.31 and 3.39 times longer than those used in furniture and construction temporary equipment, respectively (Chang, 2015). Therefore, the Korean Forest Service has developed policies to increase the proportion of domestic wood used in wooden buildings.
To increase wood usage through building expansion, it is essential to implement supportive policies and conduct foundational research on the factors that ensure structural safety and predict building performance. Suh et al. (2012) reported that a joint performance analysis is necessary to ensure the structural safety of wood and understand its performance. Nail joints are among the most frequently used joints in wooden constructions. In light-frame construction, nail joints connect sheathing panels to studs or plates (Sinha and Gupta, 2009). The nail joints in light-frame constructions allow the floor to act as a structural diaphragm or transfer horizontal loads to the foundation (Sartori and Tomasi, 2013). Lee and Jang (2023) evaluated the lateral resistance of light-frame wood shear walls based on nail spacing.
Nail and fastener joints have been studied both nationally and internationally (Kang et al., 2023; Lee et al., 2022; Liu et al., 2022). Plesnik et al. (2016) reported the effects of rigid insulation on nail joints. Oh (2013) tested the pull-out performance and lateral load resistance of nail joints composed of structural lumber and oriented strand board (OSB) in a light-frame wood structure and reported that the specific gravity and nail joint performance was proportional. Studies have also reported the effects of the sheathing panel material type and nail shape on the performance of nail joints (Hwang and Shim, 2009; Suh et al., 2012). Muñoz et al. (2008) introduced six methods for deriving the nail joint yield performance in North America, Europe, Japan, and Australia.
In Korea, the shear performance of nail joints is evaluated by one- or two-sided lateral load resistance tests according to KS F 2153 (testing method for the lateral load resistance of mechanical timber joints). However, it is difficult to apply the standard to calculate their yield performance because the calculation method from the load-displacement results obtained through the test is not clearly presented. This study was, therefore, undertaken to provide foundational data for revising KS F 2153 and to demonstrate the performance differences in nail joints based on the method of joining the lumber and panels.
2. MATERIALS and METHODS
Dimension lumber with cross-sectional dimensions of 38 × 140 mm and an OSB was used as the main and side members of the nail joint. The species of the lumbar spine was spruce-pine-fir, and the visual grade was grade 2. When the density and moisture content of the main member were measured after the lateral load resistance test of the nail joint, the mean values were 0.42 g/cm3 and 11.8%, respectively. The OSB, which is a structural board with a thickness of 11.1 mm, was produced by Tolko Industries (Renton, WA, USA) and had a span rating of 24/16. The density and moisture content of OSB were 0.62 g/cm3 and 10.9%, respectively. The fasteners used for the joints were galvanized full round-head nails from the Senco Company (Cincinnati, OH, USA), with a diameter of 2.87 mm and a length of 64 mm. The bending yield strength of the nails was 689 MPa.
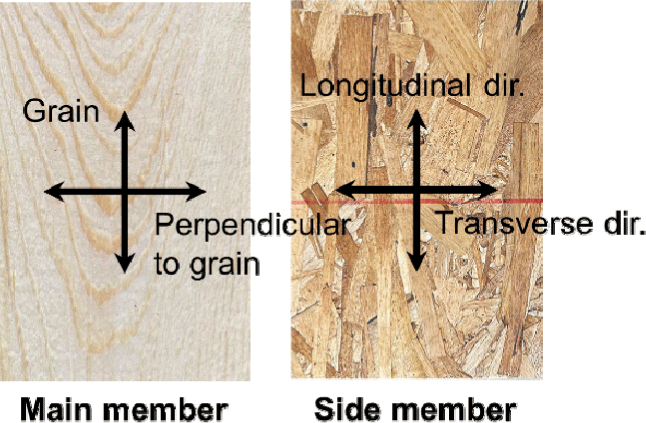
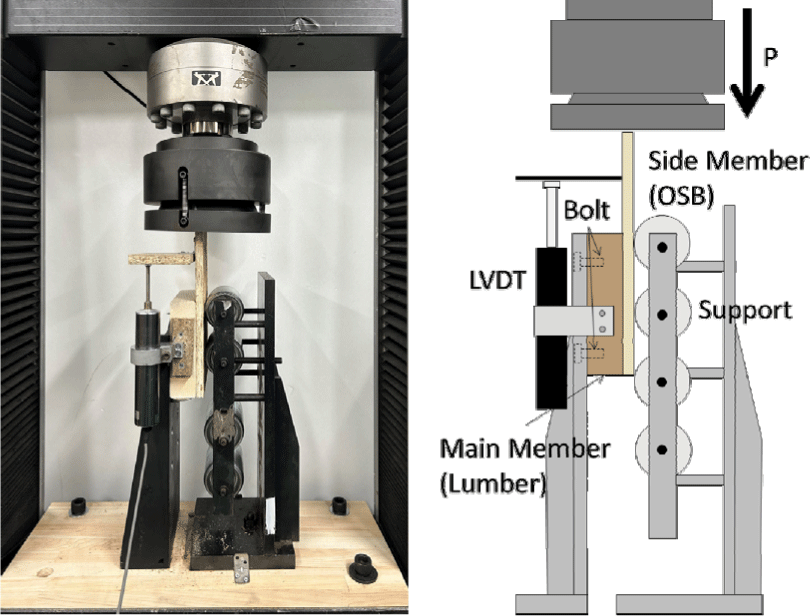
The nail joints were assembled using a single nail between the structural lumber and sheathing panel, with minimum end and edge distances in accordance with KDS 41 50 30 (design of timber joints). The nailed surface was pre-drilled with a diameter equal to 70% of the nail diameter to increase the manufacturing precision. Four types of joints were fabricated, and the details of the orientation of the main and side members for each type are provided in Table 1. Fig. 1 shows the lateral load resistance test of the nail joint using a one-sided shear test according to KS F 2153. A compressive load with a maximum capacity of 200 kN was applied to the side members using a universal testing machine (Instron, Norwood, MA, USA). The main member was fixed to a rigid frame attached to a universal testing machine with the support firmly pressed against the surface of the side member to prevent gaps between the main and side members during testing. Displacement during the lateral load resistance test was measured using a linear variable-displacement transducer (CDP-50, TML, Tokyo, Japan). The repetition number of the lateral load resistance test was repeated 12 times for each joint type.
| Type | Direction | ||
|---|---|---|---|
| Main member | Side member | ||
| M(G)S(L) | Grain | Longitudinal |
|
| M(G)S(T) | Grain | Transverse | |
| M(P)S(L) | Perpendicular to grain | Longitudinal | |
| M(P)S(T) | Perpendicular to grain | Transverse | |
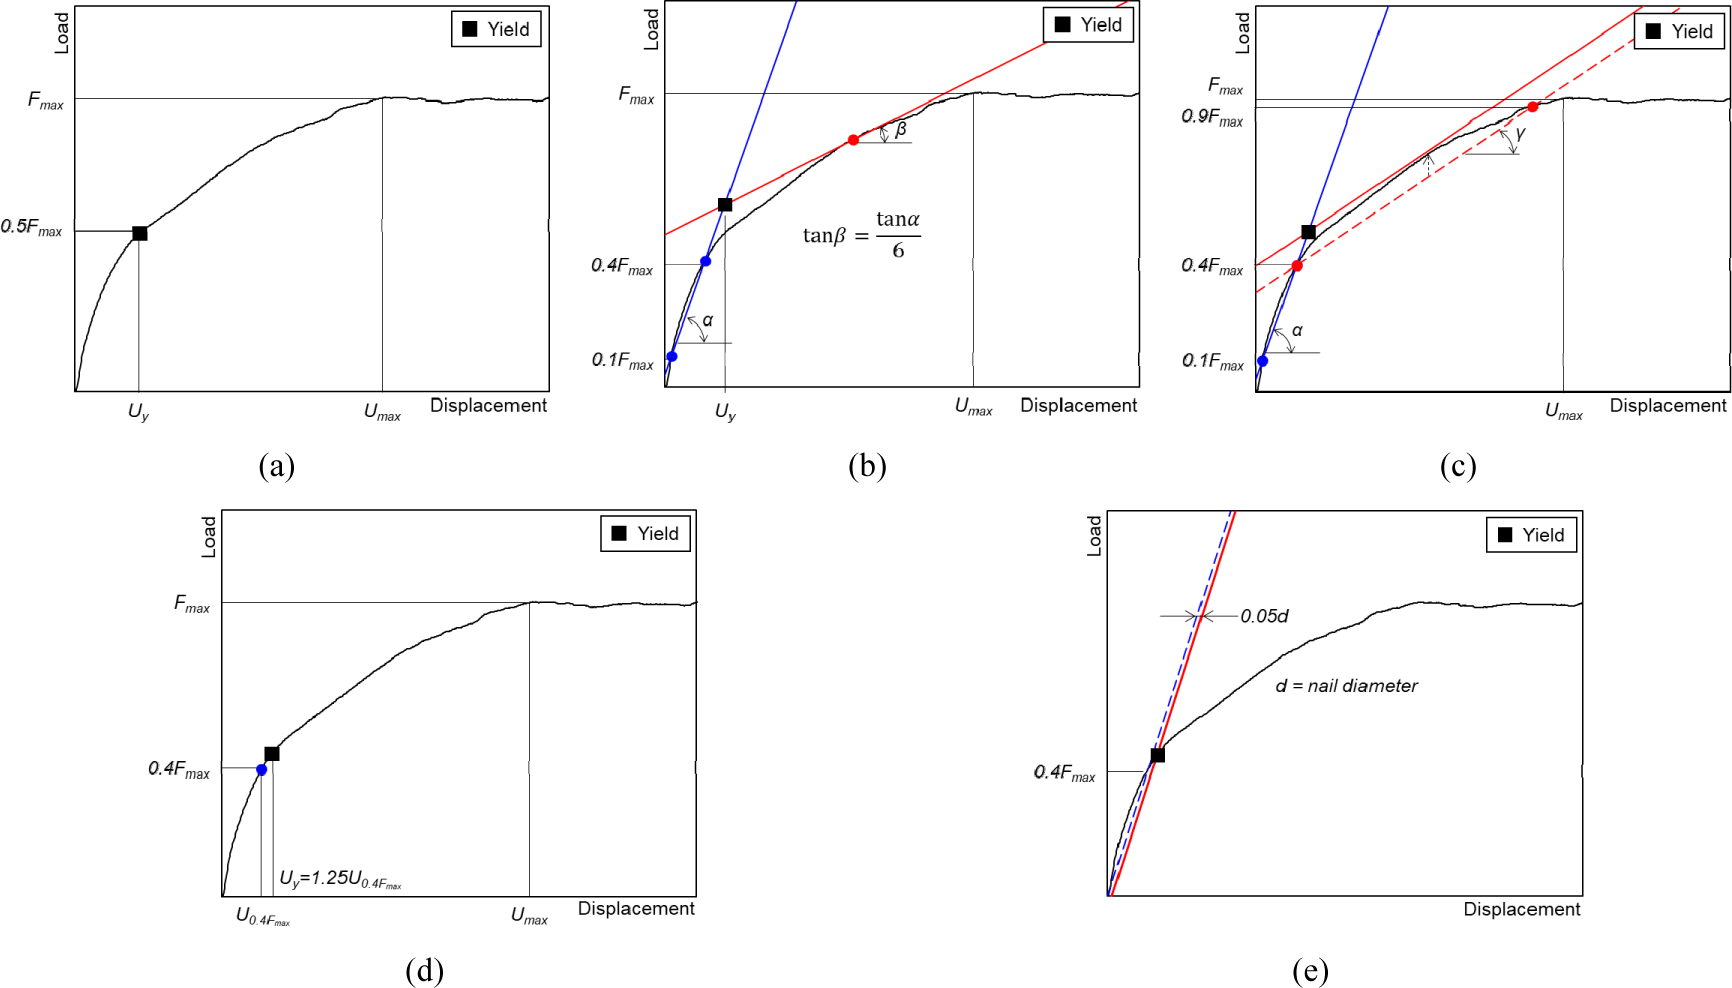
The shear properties were calculated using the displacement graphs obtained from the lateral load resistance test of the nail joint. The calculated shear properties included the maximum load resistance, yield load resistance, slope of the first linear segment, slope of the second linear segment, and ductility. The slopes of the first and second linear segments are specified in KS F 2153. The slope of the first segment is calculated from the origin of the load-displacement graph to the point of the yield load resistance, whereas the slope of the second segment is obtained from the point of yield load resistance to the point of maximum load resistance. In the absence of a defined method for calculating the yield load resistance in KS F 2153, methods proposed in previous studies were adopted. Fig. 2 presents the calculation methods; refer to Muñoz et al. (2008) for more details.
The accuracy of predicting the shear properties of the nail joints using various calculation methods was evaluated by calculating the root-mean-squared error (RMSE). First, the yield resistance load obtained using each calculation method was used to derive a bilinear curve, as presented in KS F 2153. Second, the load-displacement curve from the one-sided shear test was modeled using linear regression to represent the load-displacement relationship. Finally, the difference in the lateral resistance load of the nail joints according to the displacement was calculated using Equation (1), and the RMSE values for each calculation method were compared. A lower RMSE indicates a higher accuracy in predicting the shear properties of the nail joints. The equation for calculating the RMSE is as follows:
Where N is the discrete displacement number, np,i is the predicted lateral resistance load at the ith displacement in the bilinear curve and nm,i is the measured lateral resistance load at the ith displacement in the linear regression.
The structural safety was assessed by comparing the lateral yield load resistance calculated from the predictive equations in the references (American Forest and Paper Association, 2015; Japan 2X4 Home Builders Association, 2002; Zimmer and Lißner, 1992) with the lateral yield load resistance obtained experimentally. The Japan 2X4 Home Builders Association (2002) and Zimmer and Lißner (1992) calculated the lateral yield load resistance of nail joints using Equations (2) and (3), respectively:
Where Py is the lateral yield load resistance (N), N is the coefficient by nailing method (1 for surface nailing), C is the coefficient determined by Equation (4), Fes is the embedment strength of the side member (MPa), d is the nail diameter (mm), t is the thickness of the side member (mm), and ρs is the density of the side member (g/cm3).
Where, β is the ratio of the embedment strength of the main member to the side member, and My is the bending yield moment of the nail (N·mm). In American Forest and Paper Association (2015), the lateral yield load resistance takes the minimum value of the five yield modes based on the different possibilities of wood embedment and nail bending. The details are presented in Table 12.3.1A of American Forest and Paper Association (2015), and the calculations were performed by excluding the reduction term (2.2).
3. RESULTS and DISCUSSION
Table 2 lists the maximum load resistance of the nail joints and the displacements at that time. The maximum lateral load resistance was measured to be 1.50 kN at M(P)S(L), while the minimum lateral load resistance was found to be 1.37 kN at M(G)S(L). When the maximum lateral load resistance is obtained, the displacement is 17.45 mm. The displacement was 13.41 mm at minimum lateral load resistance. It appeared that the maximum lateral load resistance and displacement were proportional.
The effects of the direction of the main and side members on the mean values of the maximum lateral load resistance and displacement of the nail joint were examined. It was concluded that the orientation of the main and side members did not affect the maximum lateral load resistance of the nail joint because the analysis of variance (ANOVA) with a 95% confidence level for the load resistance presented a p-value of 0.53. Similarly, an ANOVA was conducted for the displacement, yielding a p-value of 0.03, indicating that the displacement was influenced by the direction of the main and side members, unlike the maximum lateral load resistance.
It was confirmed that the displacement was primarily influenced by the direction of the main member when the average displacement according to the direction of the main and side members was tested at a 95% confidence level. Fig. 3 presents the failure modes after the lateral load resistance test for each type of nail joint. The failure modes of the main and side members after the lateral load resistance test demonstrated no differences in the failure modes of the side members according to the loading direction. By contrast, the main members exhibited various failure modes. When a load was applied perpendicular to the grain angle, failure occurred with tension and shear around the grains. When a load was applied parallel to the grain angle, the nail hole expanded without tension failure. It was considered that when the load was applied perpendicular to the grain angle, more brittle failure occurred than when it was applied parallel to the grain. Thus, a larger lateral load resistance was observed at a smaller displacement in the case of brittle failure.
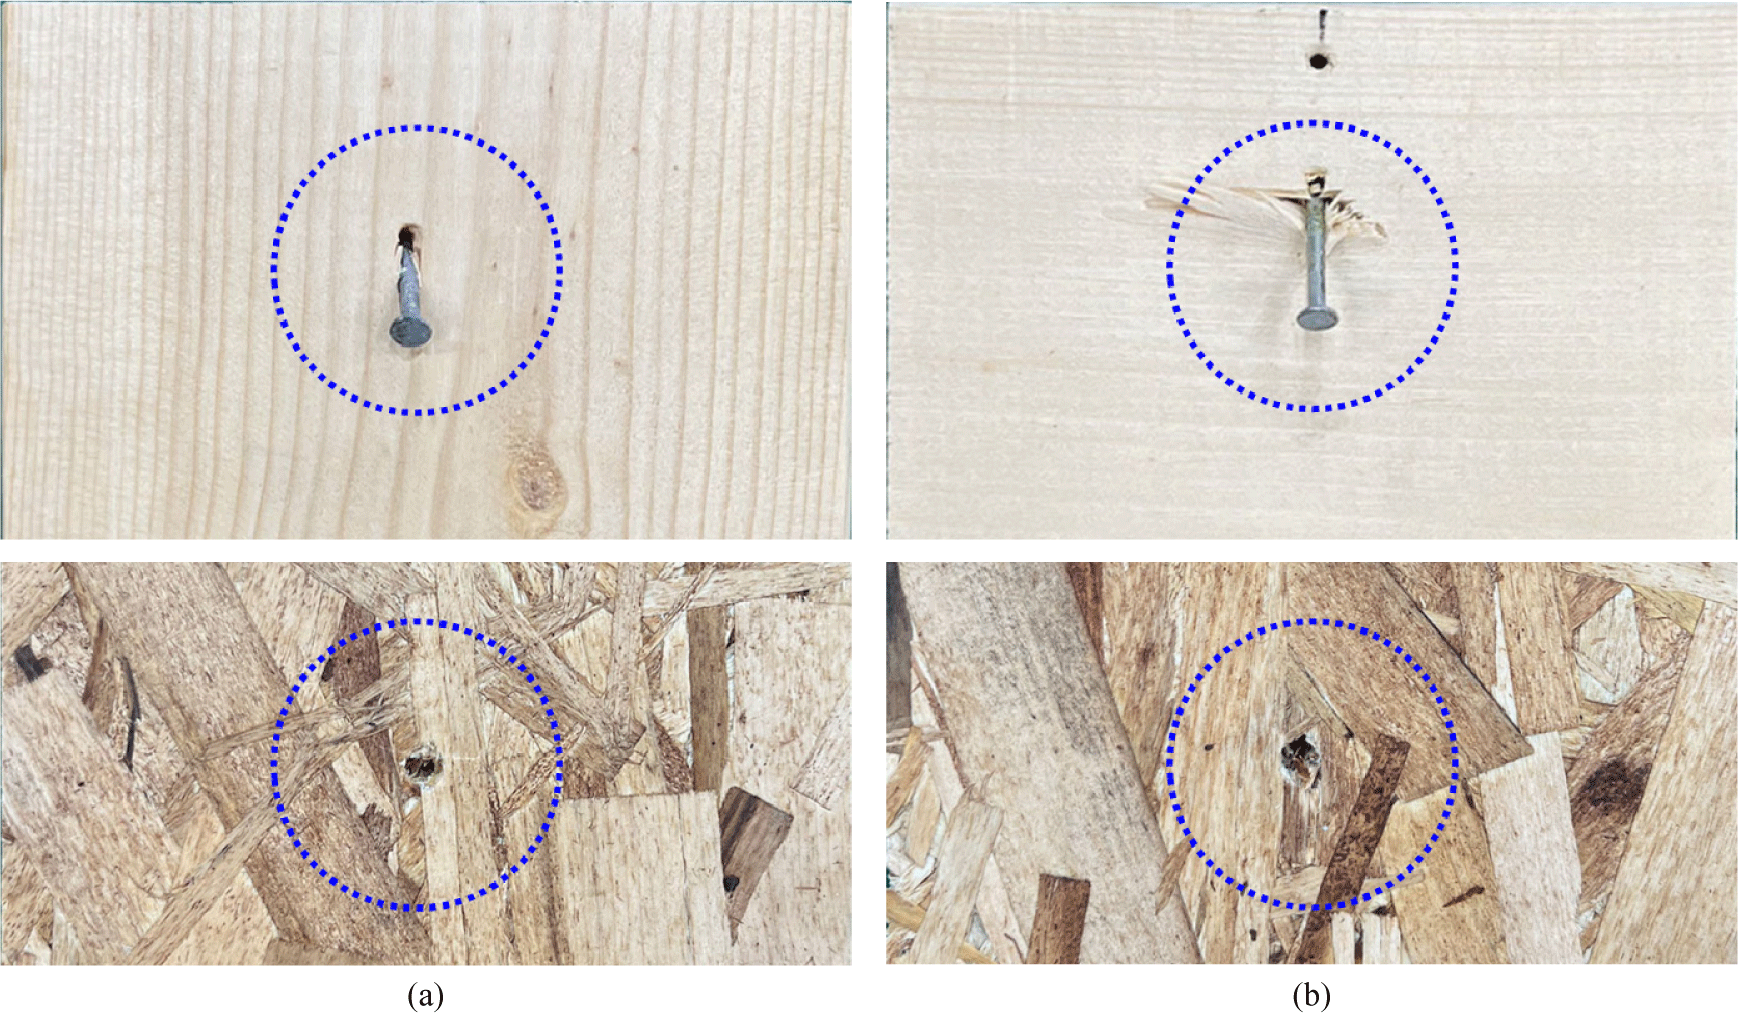
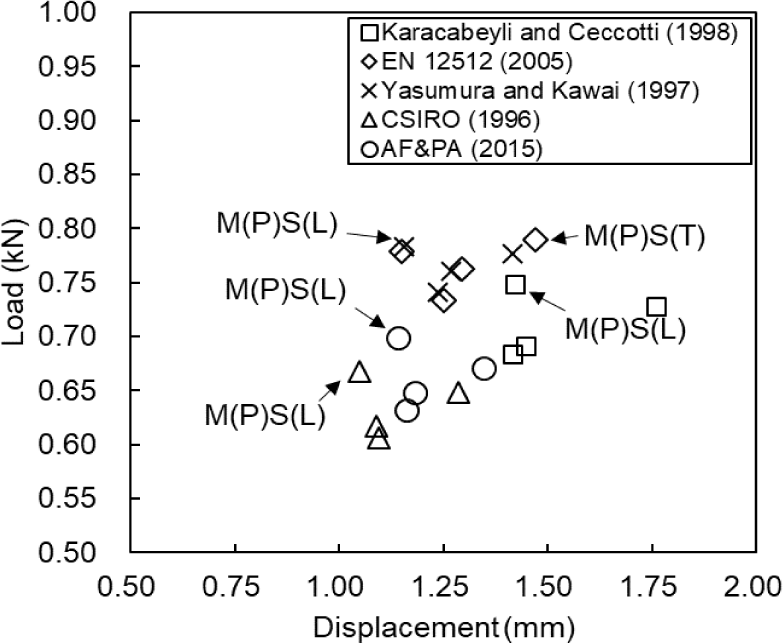
Fig. 4 and Table 3 present the yield properties of each nail joint, calculated based on the method for deriving the yield values of the joints presented in Fig. 2. The yield displacement and lateral yield load resistance of the nail joints were proportional. The highest lateral yield load resistance was obtained by using the method presented by American Forest and Paper Association (2015). The lowest lateral yield load resistance was determined using the method reported by Commonwealth Scientific and Industrial Research Organisation (CSIRO, 1996). The yield properties resulting from the various methods indicated that the highest lateral yield load resistance was observed when the load was applied perpendicular to the grain of the main member. This is analogous to the results of the maximum lateral load resistance of the nail joints. The maximum values of the lateral yield load resistance of the nail joints derived using the methods presented by Karacabeyli and Ceccotti (1998), European Committee for Standardization (2005), Yasumura and Kawai (1997), CSIRO (1996), and American Forest and Paper Association (2015) were 0.75, 0.79, 0.78, 0.67, and 0.70 kN, respectively.
Data from Karacabeyli and Ceccotti (1998).
Data from Yasumura and Kawai (1997).
Data from CSIRO (1996).
Data from American Forest and Paper Association (2015).
To determine whether the yield displacement and lateral load resistance varied according to the method used, an ANOVA was conducted on the five yield displacements, and the lateral load resistance was calculated for each joint configuration. The p-values for the yield displacement and lateral load resistance for M(G)S(L) were 0.58 and 0.0001, respectively, confirming that the lateral yield load resistance of the joint configuration varied depending on the calculation method. Similarly, the yield displacement or lateral yield load resistance of M(G)S(T), M(P)S(L), and M(P)S(T) varied depending on the calculation method, except M(P)S(T).
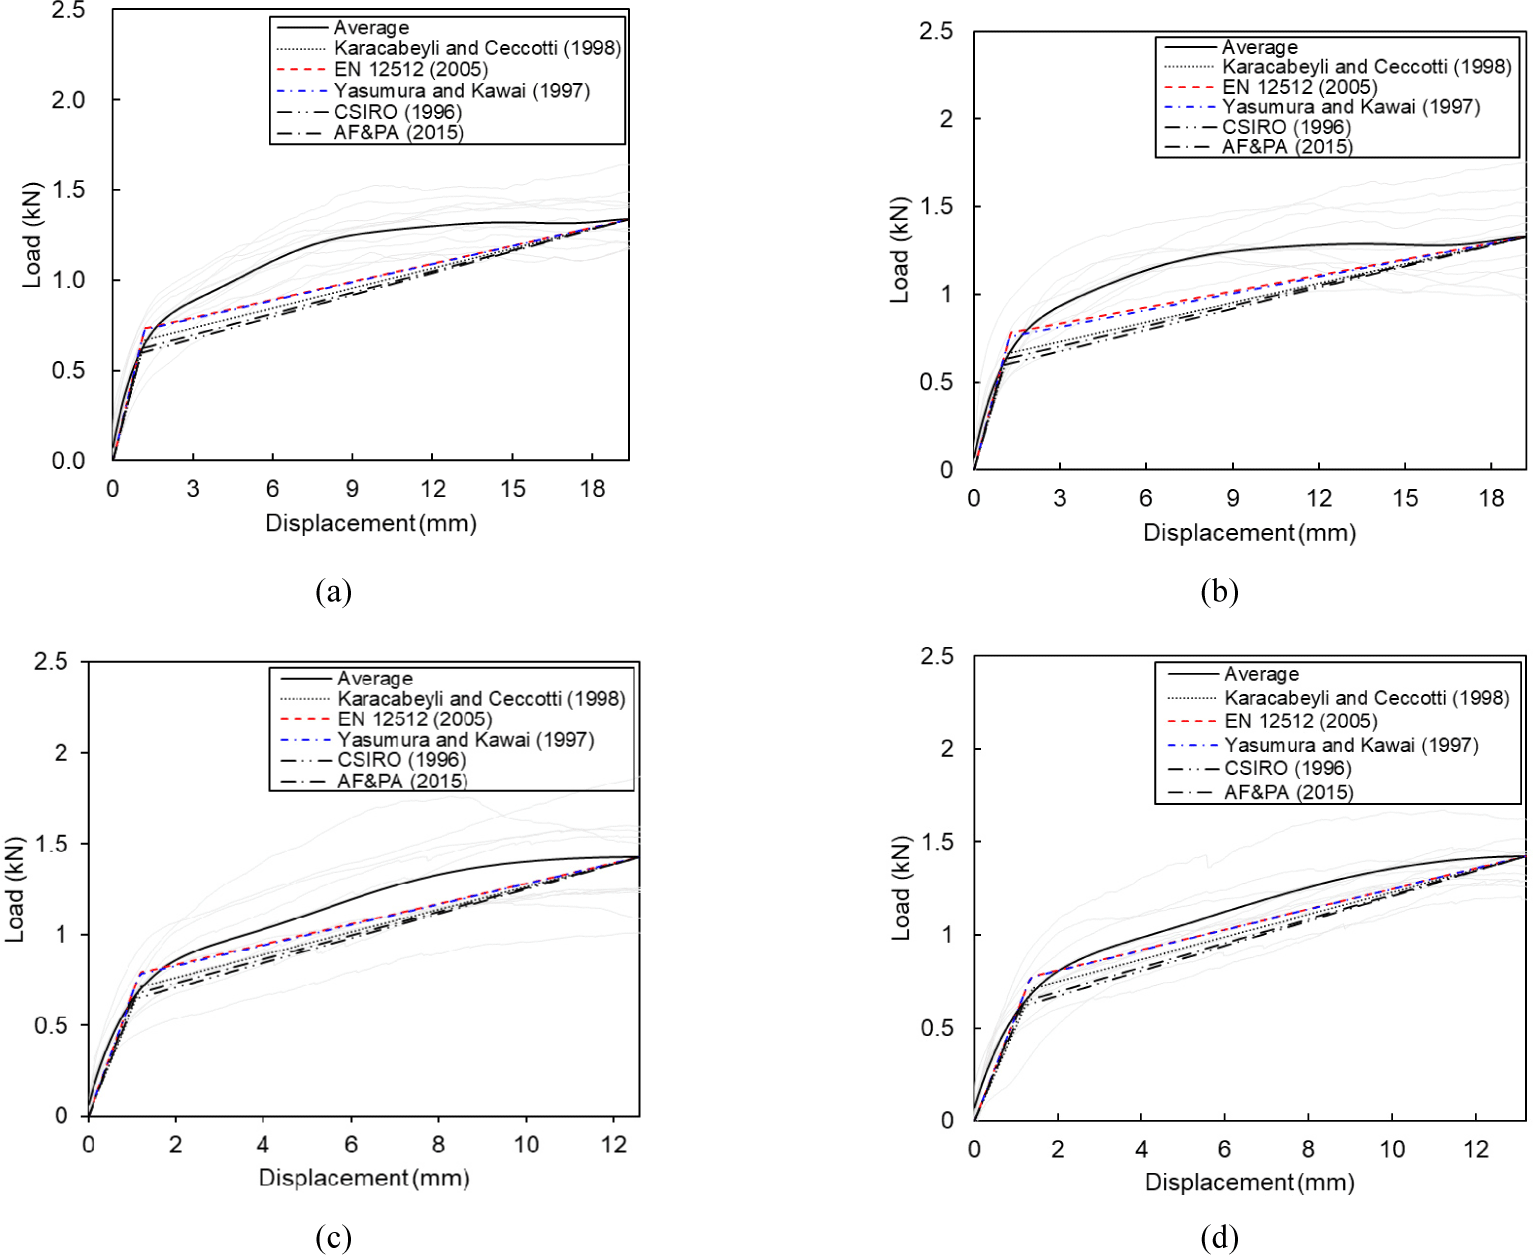
Fig. 5 presents the load-displacement graph obtained from the joint shear test and the bilinear curve determined by the yield properties derived from the five calculation methods used in this study. Table 4 presents the first and second slip moduli of the bilinear curve in Fig. 5 and the RMSE between the load predicted by the bilinear curve and the average load obtained from the actual lateral load resistance test. The first shear modulus calculated using the method presented in European Committee for Standardization (2005) and Yasumura and Kawai (1997) was higher than that of the other methods. This was because of the different initial stiffness ranges used to calculate the yield properties. As presented in Fig. 2, the two methods use 0.1 to 0.4 of the maximum loads to calculate initial stiffness, while the other methods use a range of 0.4 or 0.5 of the maximum loads from the origin. The methods proposed by European Committee for Standardization (2005) and Yasumura and Kawai (1997) were expected to remove clearance from the nail joint or experimental setup using an initial value of 0.1 of the maximum load. A comparison of the RMSE values based on the nail joint configuration and calculation method revealed that the method proposed by European Committee for Standardization (2005) consistently had the lowest RMSE, indicating high prediction accuracy, as presented in column 5 of Table 4.
Data from Karacabeyli and Ceccotti (1998).
Data from Yasumura and Kawai (1997).
Data from CSIRO (1996).
Data from American Forest and Paper Association (2015).
Table 5 lists the factors for calculating the lateral yield load resistance of the nail joints and the estimated results of the lateral yield load resistance calculated using the method described in Section 2.5. The lateral yield load resistances calculated from Equations (2) and (3) and the method presented by the American Forest and Paper Association (2015) were 0.63, 0.66, and 0.63 kN, respectively. The values were calculated using Equation (2) and the method presented by the American Forest and Paper Association (2015) were the same. This is because the yield mode assumed in Equation (2) is the same as that representing the minimum of the five yield modes considered in American Forest and Paper Association (2015). These yield modes involve fastener bending at one plastic hinge point per shear plane and bearing-dominated yielding of wood fibers in contact with the fastener in the side member (American Forest and Paper Association, 2015). Compared with the experimental values of the lateral yield load resistance listed in Table 3, the experimental values obtained by the methods presented in CSIRO (1996) and American Forest and Paper Association (2015) were lower than the calculated values. As the experimental values should be higher than the predicted values to ensure structural safety, the methods presented by American Forest and Paper Association (2015) and CSIRO (1996) were not considered appropriate for this study. Conversely, the other three methods demonstrated higher experimental values than the predicted values, making them suitable for calculating the lateral yield load resistance of nail joints in this study.
| Main member | Side member | Nail | Py, kN | ||||||
|---|---|---|---|---|---|---|---|---|---|
| Fem 1) | tm 2) | ρs3) | Fes 1) | ts 2) | D 4) | Fy 5) | A6) | B7) | C8) |
| 35 | 38 | 0.42 | 38 | 11.1 | 2.87 | 689 | 0.63 | 0.66 | 0.63 |
Calculated using Equation (2; kN).
Calculated using Equation (3; kN).
Calculated according to American Forest and Paper Association (2015; kN).
A comparison of the RMSE values between the bilinear curve and the actual load-displacement curve, along with the predicted lateral yield load resistance obtained using each method, indicated that the method presented in European Committee for Standardization (2005) was the most suitable for deriving the yield properties of nail joints not defined in KS F 2153. The lateral yield load resistance of the nail joints, as determined by the method presented in European Committee for Standardization (2005), were 0.73, 0.76, 0.78, and 0.79 kN for M(G)S(L), M(G)S(T), M(P)S(L), and M(P)S(T), respectively, with corresponding yield displacements of 1.25, 1.29, 1.15, and 1.47 mm.
4. CONCLUSIONS
This study proposes a method for deriving undefined yield properties during lateral load resistance tests of timber structural joints using KS F 2153. By analyzing the error and differences between the predicted lateral yield load resistance, the average load-displacement curve obtained from actual experiments, and the bilinear curve derived from the yield properties, this study concluded that the method presented in European Committee for Standardization (2005) was appropriate. The average yield displacement and yield load of the nail joints were 1.29 mm and 0.77 kN, respectively. The average maximum yield displacement and yield load of the nail joints were 15.30 mm and 1.43 kN, respectively. However, this study was based on results observed for specific nails and joints, suggesting that further research is required to consider additional variables.
