1. INTRODUCTION
Rattan, along with wood and bamboo, is a crucial material used in furniture production and vital for human daily living. Rattan, a climbing palm of the Arecaceae family, is highly sought after in the furniture and handicraft markets. Rattan is categorized as a rapidly growing plant, leading forest dwellers to prioritize harvesting rattan over timber. Other benefits of rattan over wood are its light weight, elasticity, and low cost. In Indonesia, rattan is abundant across the large islands of Sumatra, Java, Sulawesi, Kalimantan, Papua, and Nusa Tenggara and encompasses a wide range of species. Jasni and Krisdianto (2012) documented a comprehensive list of 312 rattan species found on various Indonesian islands along with their respective distribution patterns. In 2022, Indonesia’s rattan production will reach approximately 1,387,809 stems, or 12,316 tons, according to Badan Pusat Statistik (2023).
To utilize rattan in furniture and construction (chairs, tables, sofas, bookshelves, scaffolding, and concrete reinforcement), it is necessary to know its density. Density in various applications provides fundamental data regarding the durability of rattan materials. The density of rattan can be determined by considering its moisture content (MC), both when it is green and air-dried. Rattan has immensely different values for the green and air-dry densities. The disparity in density between these two substances is more pronounced than that observed for wood. The significant variations in both the green and air-dry densities of rattan were utilized as separate metrics to assess the density status. This research focused on investigating the density of the transverse and bark surfaces of rattan, as it does not exhibit anisotropic features such as wood (transverse, radial, and tangential).
This study utilized nondestructive near-infrared (NIR) spectroscopy to develop a density prediction model for rattan. Schwanninger et al. (2011) emphasized that NIR provides a distinctive blend of rapidity, simple sample preparation, user-friendliness, nondestructiveness, and reliable reproducibility. NIR refers to electromagnetic waves with wavelengths between 800 nm and 2,500 nm. These waves can be used to study the fundamental vibrations (molecular vibrations) of organic compounds containing various functional groups (Tsuchikawa and Kobori, 2015). NIR spectra were used to measure the green and air-dry densities of the transverse and bark surfaces of the rattan. Unfortunately, there is a significant dearth of research on the use of NIR spectroscopy for rattan materials. This area of research was only explored in a single investigation conducted by Wang et al. (2011). This study focused on predicting the length of fibers and vessels in rattan using a wavelength range of 350–2,500 nm. This study followed a tutorial written by Williams et al. (2017) regarding the items to be included in a report on an NIR spectroscopy project. We hope that this research will improve the development of NIR spectroscopy for predicting rattan density. This outcome provides an initial assessment of the viability of using NIR spectroscopy to analyze rattan materials in industry.
2. MATERIALS and METHODS
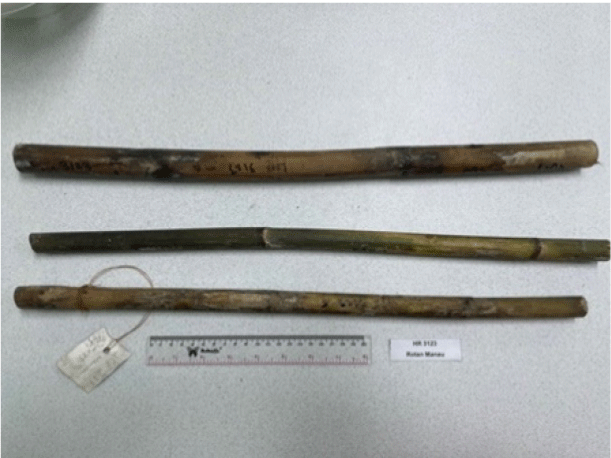
Rattans of many species grown in the Sumpur Kudus Social Forest, Sijunjung, West Sumatra, Indonesia, were used in this study. Sixty-five rattan samples were used in this study. These samples consisted of many species, including tabu-tabu/julen (Calamus ornatus), jernang beruk (Calamus gracilipes), and sikai [Calamus melanchaetes (Blume) Miq.], and balam (Calamus aff.C. erioacanthus), cikolo (Calamus spp.), cakur (Calamus geniculatus), manau (Calamus manan), batu (Calamus spp.), danan (Korthalsia concolor), plode (Calamus hirsutus ssp. Hirsutus), and tunggal (Calamus laevigatus). The diameters of the rattan samples varied from 0.7 to 2.7 cm. Fig. 1 shows the rattan samples of the manau species. Rattan samples were cut into 5 cm lengths to obtain a small tube shape (longer than 1 cm from the density sample of rattan from Ahmed et al. (2022). The density was obtained by dividing the weight (g) by the volume (cm3) of the sample. This study used green and air-dry density conditions. The weights of the green density samples were recorded upon their initial arrival at the green condition. The weight of air-dry density samples was determined three months after being stored in a laboratory at a regulated temperature of 24°C. Volume was obtained by measuring the dimensions (cm3), and weight was calculated using a digital scale (g).
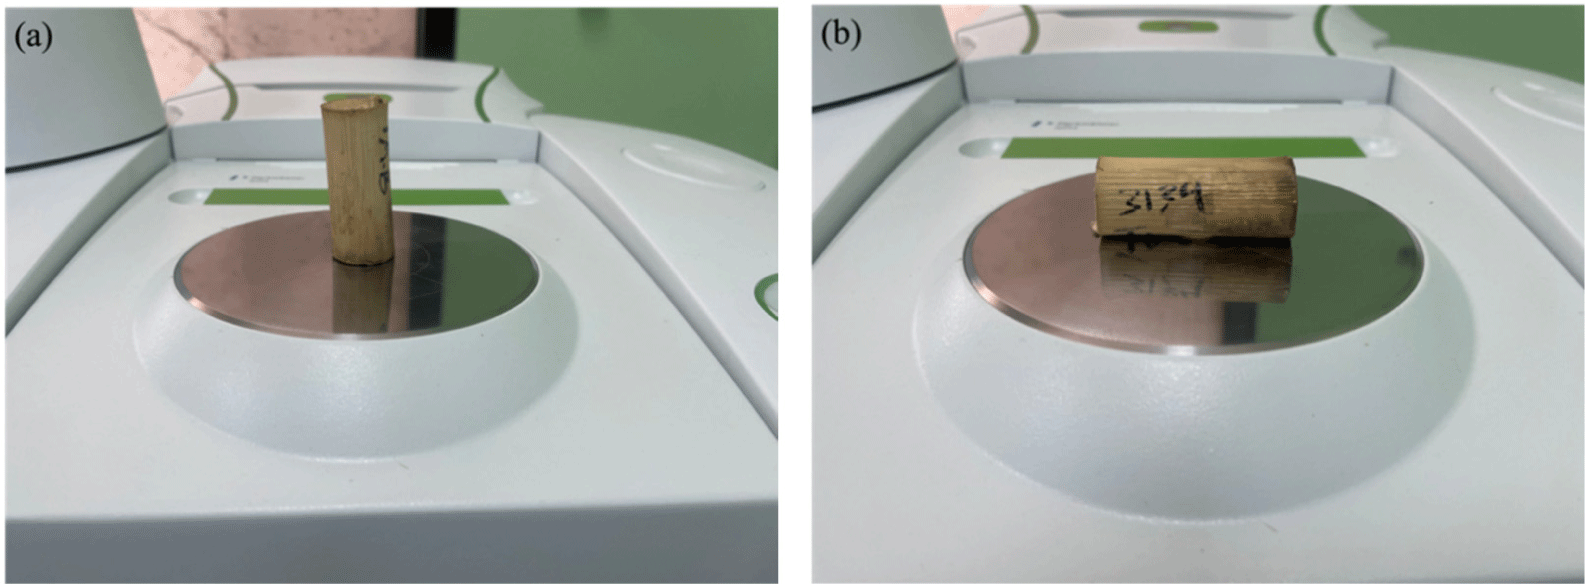
A Spectra 100N FTNIR Spectrometer (PerkinElmer, Waltham, MA, USA) was utilized at the Integrated Laboratory of Bioproducts (iLaB) located in the Science and Techno Park of Dr. (H.C.) Ir. Soekarno, Cibinong, Bogor, Indonesia. This instrument was used to obtain NIR spectra of 65 rattan samples. The spectra were acquired from the transverse and bark surfaces of the rattan stems, as depicted in Fig. 2. The NIR spectra obtained from the transverse surface were the average spectra derived from the upper and lower transverse surfaces of the rattan tube samples. The spectra were obtained in the wavelength range of 750–2,500 nm, with a scan resolution of 16 cm–1 and an accumulation of 32 scans. The absorbance values of the NIR spectra were measured and recorded as NIR spectral data. All NIR spectra were obtained in a laboratory environment with regulated temperature and relative humidity (24°C and 52%). This study utilized an air-dry density state similar to that used in previous research by Yang et al. (2017), who classified lumber using NIR spectroscopy.
Wavelength selection was applied at 1,400–2,500 nm, as this wavelength range could result in better prediction than using the complete wavelength or many trial selections. The mean center was applied to all spectral data as a pretreatment for the spectra. Pre-processing spectra treatments, such as standard normal variate/SNV, multiple scatter correction/MSC, first derivative (1st der.) with a 25 smoothing points (sp) Savitzky-Golay polynomial, and 2nd der. was applied at 25 sp. Rinnan et al. (2009) asserted that the aim of preprocessing is to eliminate physical phenomena in the spectra to enhance multivariate regression, classification models, or exploratory analysis. Leave-one-out cross-validation partial least squares regression (LOO CV-PLSR), as multivariate data analysis or chemometrics, was applied to obtain the best density prediction model constructed for rattan from the transverse and bark surfaces under green and air-dry density conditions. The best density prediction model was considered to have the highest coefficient of determination for cross-validation (R2CV). This value of R2CV is accompanied by a series of values for the number of latent variable (LV), coefficient of determination for calibration (R2C), root-mean-square error for cross-validation (RMSECV), root-mean-square error for calibration (RMSEC), and ratio of performance to deviation (RPD). MATLAB R2023b (MathWorks, Natick, MA, USA) was used for the data analysis.
3. RESULTS and DISCUSSION
The average green density of the rattan samples was 1.000 g/cm3, whereas the average air-dry density was 0.445 g/cm3. These values were obtained for the 65 samples. The green densities ranged from 0.828 to 1.218 g/cm3, whereas the air-dry densities ranged from 0.264 to 0.695 g/cm3 (Table 1). The air-dry density of rattan in this research closely aligns with the findings reported by Dungani et al. (2014), ranging from 0.25 to 0.59 g/cm3, and Abdurachman et al. (2017), ranging from 0.29 to 0.73 g/cm3. The green and air-dry densities of the rattan samples were 1.000 and 0.445 g/cm3, with SD values of 0.0775 and 0.0931 g/cm3. The diminishing values from green to air-dry densities were approximately twice as high. Vessels (vascular bundles) under these conditions are expected to have a very high MC after harvesting. This substantial quantity of MC gradually dissipates to reach a state of equilibrium moisture content over time under the influence of the surrounding temperature. This may explain why rattan materials exhibit a significant weight reduction when dried in air, making them considerably lighter than when they are in their natural moist state. Dwianto et al. (2020) demonstrated that rattan has a higher MC than wood and bamboo, despite having the lowest air-dry density.
| Density (g/cm3) | N | Mean (g/cm3) | SD (g/cm3) | Min (g/cm3) | Max (g/cm3) |
|---|---|---|---|---|---|
| Green | 65 | 1.000 | 0.077 | 0.828 | 1.218 |
| Air-dry | 65 | 0.445 | 0.093 | 0.264 | 0.695 |
Rattan, a lignocellulosic material, is a natural composite material consisting primarily of the inner and outer regions of vascular bundles and ground tissues (parenchyma cells), as studied in Calamus caesius by Yu et al. (2023). The structure of the rattan cross-section is composed of vascular bundles and parenchyma cells, and NIR lighting illuminates these components. Thus, rattan can be quantified using NIR lamps. According to Nikmatin et al. (2011), rattan bark consists of carbon (C) and oxygen (O) with mass percentages of 47.5% and 46.03%, respectively. Rattan is composed of holocellulose, lignin, extractives, and ash, with weight percentages (wt%) ranging from 78.0 to 78.9, 9.1 to 17.9, 1.5 to 5.1, and 2.0 to 7.7 wt%, respectively (Ahmed et al., 2022).
Fig. 3 shows the original spectra obtained from the transverse and bark surfaces of the rattan collected from 65 samples. The NIR spectra pattern of the transverse surface of rattan closely resembles the NIR spectra of wood that have been studied by several researchers, including Arriel et al. (2019), Lima et al. (2022), Loureiro et al. (2022), Medeiros et al. (2023), Ramalho et al. (2018), Sofianto et al. (2017, 2019, 2023), and Yang et al. (2019), among others, over the past six years. Yeon et al. (2019) concluded that the chemical structure of extractives influences NIR spectral patterns.
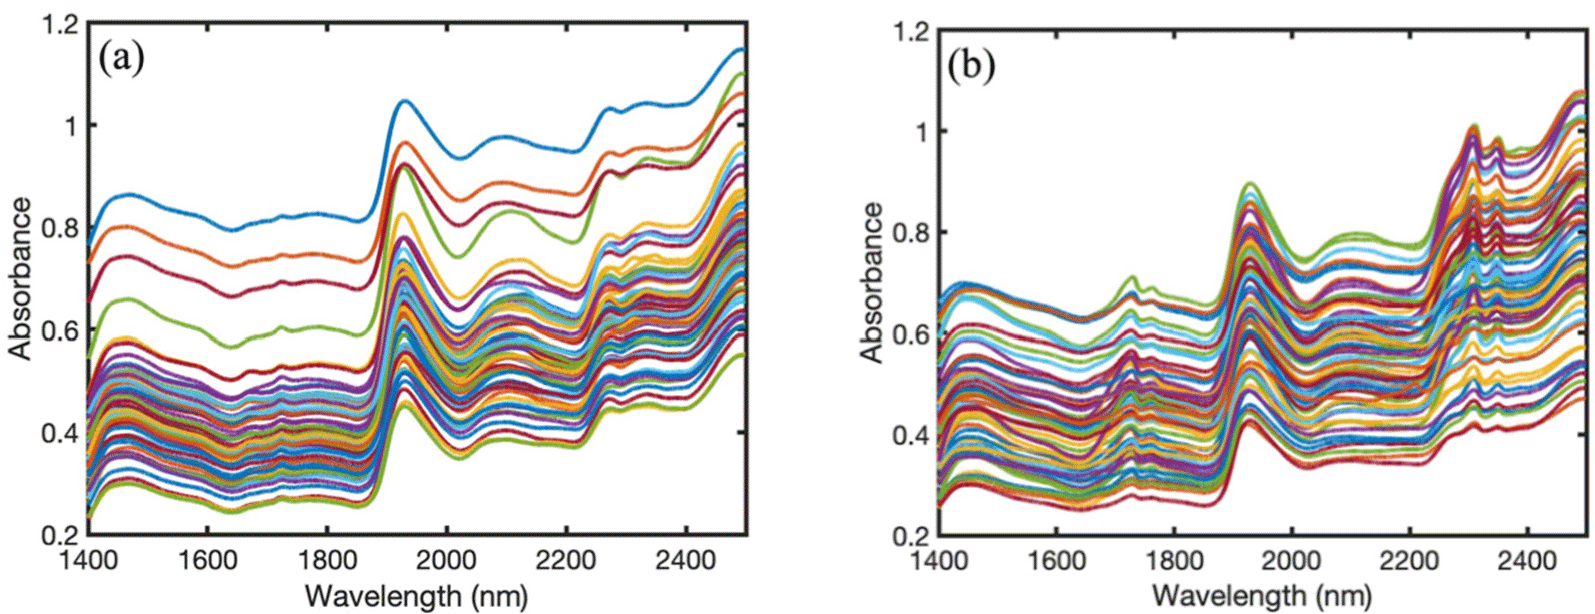
The absorbance values of the transverse surface spectra varied from 0.1472 to 1.1483, whereas those of the bark surface spectra ranged from 0.1659 to 1.0779. The disparity in the NIR absorption between the rattan bark surface and its transverse surface is attributable to their unique anatomical structures and surface properties. Szczepanowska (2018) indicated that the surface of rattan bark is comprised of biogenic silica. This biogenic silica generated a glassy and glossy coating. Silica can affect the light absorbance. The transverse section of the rattan contained vascular bundles and parenchyma, as previously described by Yu et al. (2023). Luo et al. (2012) noted that the vascular bundles adjacent to rattan bark were diminutive and compact, whereas the internal vascular bundles were large and sparse.
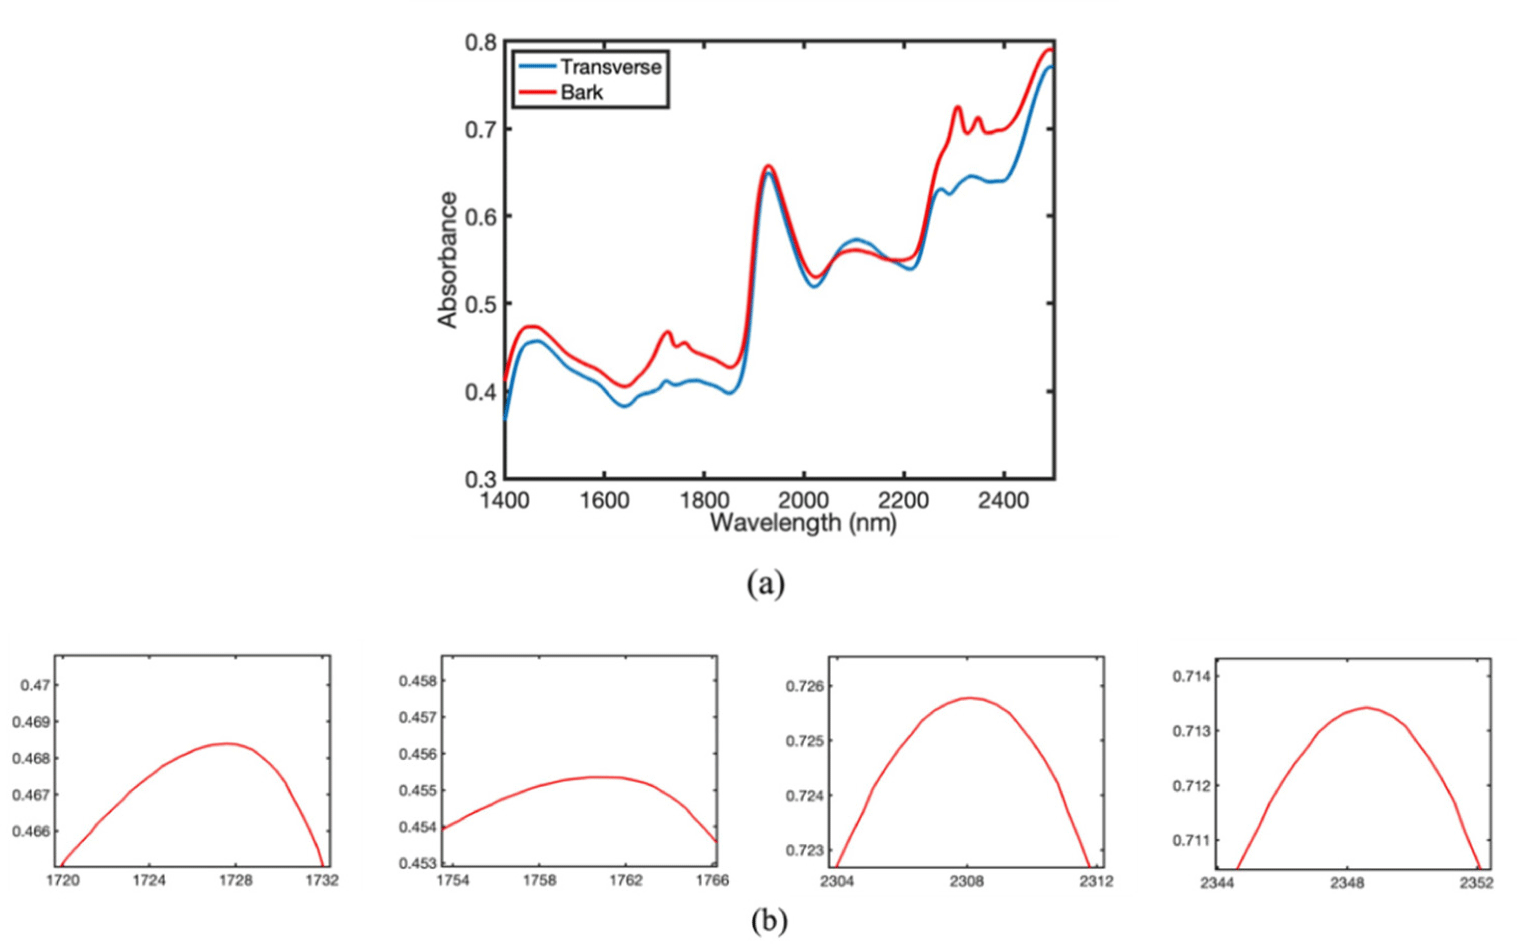
Distinct peaks were observed in the NIR spectra of the rattan bark surfaces, which are subsequently referred to as intriguing peaks. This phenomenon is more prominently demonstrated by the average spectra obtained from these categories, as shown in Fig. 4. Each noteworthy peak in the bark surface spectrum is displayed in the magnified images. The peaks at 1,728, 1,762, 2,308, and 2,348 nm correspond to specific bands for lignin (around 1,726 nm) or cellulose (around 1,731 nm), an unidentified substance (around 1,765 nm), an unrecognized substance, and cellulose (around 2,352 nm), as stated in a review by Schwanninger et al. (2011). We previously mentioned that these four intriguing peaks have distinctive rattan spectra compared to those of other lignocellulose materials owing to their unique characteristics. We used the band assignment reference for rattan from a review article by Schwanninger et al. (2011), which specifically focused on wood and wood components. Because rattan is also a lignocellulosic material, this reference is applicable. However, Schwanninger et al. (2011) did not identify significant peaks at 2,308 nm. Research related to prediction models of lignin using NIR performed by Hwang et al. (2021) stated that the regions of 1,400–1,500 nm were assigned to phenolic groups, and the region around 1,700 nm was assigned to aromatic rings and C-H bonds of lignin.
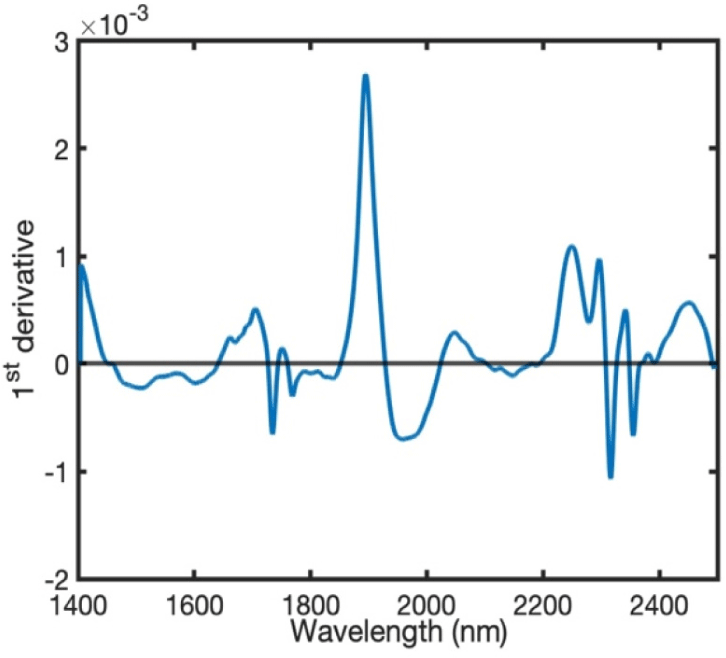
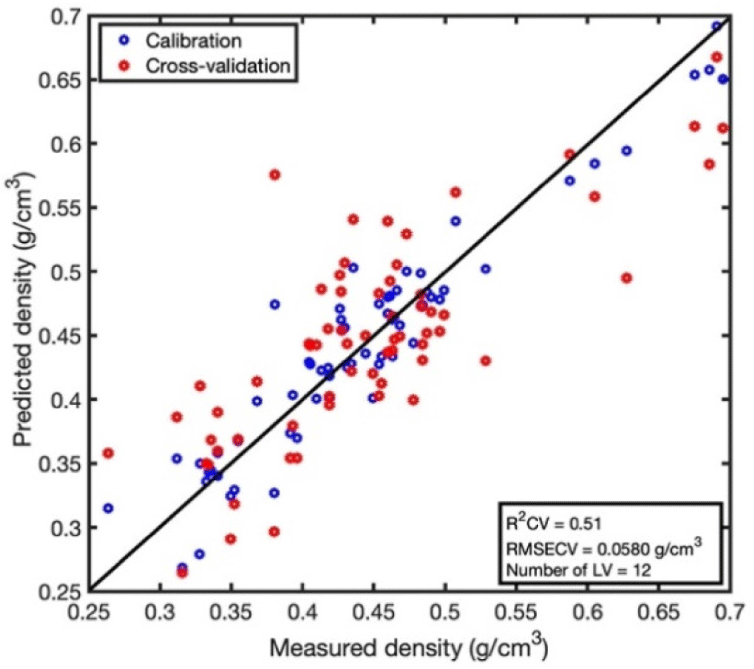
The selected wavelengths of 1,400–2,500 nm demonstrated superior predictive outcomes compared with the absence of wavelength selection. The selected shorter NIR wavelength provided advantages, including reduced scattering noise, enhanced analytical specificity, prevention of overfitting, expedited calculations, and simplified model interpretation. Table 2 displays the optimal findings of the CV-PLSR analysis for each density combination under the conditions of the MC and surface of the part. The bark surface with the air-dry density had the highest R2CV value (0.51). This value was obtained from first-order spectra of the 1st der. with 25 sp, together with a RMSECV of 0.058 g/cm3 using 12 LVs. RMSECV value of 0.0580 g/cm3 is less than 0.1 g/cm3, giving this prediction model of small error. The 1st der. the spectra at 25 sp are shown in Fig. 5. Rinnan et al. (2009) explained that derivatives can remove both additive and multiplicative effects from spectra, and the 1st der. removes the baseline. Fig. 6 shows the measured and predicted density values from the bark surfaces of the air-dried rattan using the 1st der. spectra, with 25 sp as the best prediction model using CV-PLSR analysis. When comparing the transverse and bark surfaces, the bark surface had a higher R2CV value than the transverse surface for both green and air-dried MC. These results are promising because the measurement condition of the air-dry state and bark is the most convenient method for online rattan quality grading using NIR spectroscopic equipment in the industry.
Therefore, the model is mainly applicable to rattan materials at air-dry MC. The industry must await many months for the materials to attain air-dry MC.
4. CONCLUSIONS
The density of rattan exhibited a significant variation between the green and air-dried phases. The transverse and bark surfaces of rattan in both green- and air-dry MC were analyzed to obtain the NIR spectra. The NIR spectra of the bark surface of the rattan exhibited distinct peaks at wavelengths of 1,728, 1,762, 2,308, and 2,348 nm. These peaks serve as features that differentiate the spectra of rattan from those of other lignocellulose materials. The most accurate prediction model for rattan density was developed using NIR spectroscopy and LOO CV-PLSR analysis. This model utilized the 1st der. with 25 sp spectra from the bark surface of air-dried rattan. The R2CV value of this model was 0.51. The application of this model yielded an RMSEV value of 0.0580 g/cm3 for LV 12, along an RPD value of 1.61. This study shows potential as an initial outcome for the development of NIR spectroscopy devices for industrial applications involving rattan materials.
