1. INTRODUCTION
Wood is one of the most abundant biomaterials and has been utilized for a multitude of human needs. However, the availability of wood from natural and community forests is no longer sufficient to meet the needs of the wood processing industry. This is due to the slow growth rate of wood and the high deforestation rate. Consequently, engineered wood was developed as an alternative to replace solid wood in order to reduce the use of forest wood and maintain environmental sustainability (Carrasco et al., 2024; Yadav and Kumar, 2021). Engineered wood, also referred to as human-made wood, manufactured board, fabricated board, composite wood, or fabricated board, encompasses a wide range of wood-derived products. These materials are produced by binding wood strands, particles, fibers, veneers, or boards together using adhesives to form a composite material (Chen et al., 2020; Duan et al., 2023; Milner and Woodard, 2016). The design of functional composite materials has enabled to encompass a range of properties, such as mechanical properties, lightweightness, excellent heat and sound absorption properties, and so forth, for various applications (Monteiro et al., 2018).
Moreover, the need for more environmentally friendly materials is becoming increasingly urgent in light of growing awareness of environmental impacts and climate change. In this regard, natural fiber-based engineered wood may prove to be a promising solution (Zanuttini and Negro, 2021). Several previous studies have developed engineered wood from natural fiber-based composite materials, which has attracted extensive attention and research (Hwang and Oh, 2021; Mawardi et al., 2021; Seng Hua et al., 2022; Setyayunita et al., 2022). Natural fibers offer a number of advantages, including abundant availability, rapid renewal, low cost, sustainability, lightweight construction, and a low carbon footprint (Ding et al., 2022). Natural fibers, such as bagasse, wheat, rice, pineapple, banana fiber, coir fiber (CF), empty oil palm bunches, and many more, are the primary sources of natural fibers from derived from agricultural and plantation biomass.
Sugarcane bagasse (SB) and CF are both abundant and low-cost agricultural and plantation residues. Indonesia is one of the leading producers of both types of fiber. In 2023, Indonesia had a sugarcane plantation area of 518,183 hectares with a production of 2.61 million tons of sugar. It was estimated that this would result in the production of approximately 7 to 9 tons of SB fiber. Similarly, with respect to the potential for coconut fiber, Indonesia has a coconut plantation area of 3.33 million hectares with an estimated production of 2.88 tons. It is estimated that 1 to 1.2 million tons of coconut fiber have been produced from this amount of coconut production (Directorate General of Estates, Ministry of Agriculture, 2022).
Numerous studies have investigated the physical, mechanical, acoustic, and thermal properties of SB-reinforced hybrid composites under various matrix conditions. Additionally, SB waste has been developed as a core material for engineered wood and blockboard. The core layer of the blockboard is manufactured from a composite comprising SB particles and an expanded polystyrene matrix (Mawardi et al., 2024). Kalasee et al. (2023) have developed a composite comprising SB and coffee skin as a sound-insulating material. The composite was produced using a melamine urea-formaldehyde matrix. The effect of the starch matrix on the mechanical and physical properties of SB composites has been documented by Asrofi et al. (2021), dos Santos et al. (2018), Madgule et al. (2023), Mahmud et al. (2023a), Mittal and Sinha (2018), Moussa (2024), Salatein et al. (2024). dos Santos et al. (2018) investigated the mechanical, thermal, and physical properties of wheat straw/SB and banana fiber/SB-reinforced epoxy hybrid composites. Kusuma et al. (2023) and Zafeer et al. (2023) conducted a review of the potential and characteristics of SB fiber-reinforced polymer composites as environmentally friendly and sustainable materials. Additionally, recent publications by Jamaludin et al. (2020) have presented findings on SB composites without adhesive mechanical and physical characteristics.
Furthermore, the use of CF as a reinforcement in composite-engineered wood has been documented in several previous studies. The hybridization of CF with E-glass and alumina resulted in a significant enhancement in the tensile properties of epoxy composites, with an increase of up to 280% (Hasanuddin et al., 2023). CF-reinforced composites have also been developed as thermal insulation materials (Mahmud et al., 2023b; Wang and Hu, 2016). In other studies, Hemsri et al. (2012), Ramírez et al. (2011), and Susilawati et al. (2021) have reported the use of composite-engineered wood boards reinforced with coconut fiber, with a mixture of polyvinyl acetate (PVAc), wheat gluten, and cassava starch serving as the matrix.
Previous studies have investigated the use of bagasse-based engineered wood with a range of adhesive materials. However, information on lightweight engineered wood produced through the hybridization of bagasse and coconut fiber with a mixture of tapioca starch (TPS) matrix and PVAc polymer is currently unavailable. To address this gap in knowledge, this study aimed to evaluate the properties of lightweight engineered wood by combining bagasse and CF as reinforcement and a mixture of TPS and PVAc as a matrix. To this end, a series of analyses were conducted, including bending analysis, thermal conductivity analysis, and thermogravimetric analysis.
2. MATERIALS and METHODS
The SB waste was procured from a local sugarcane juice mill in Lhokseumawe, Indonesia. Meanwhile, CF was procured from a coconut fiber processing mill in North Aceh, Indonesia. The matrix utilized in this study was TPS and PVAc, which were procured from a local market. Table 1 presents the physical and mechanical properties, as well as the chemical composition, of the constituents of engineered wood (Asrofi et al., 2020; Faruk et al., 2012; Ramlee et al., 2021a; Singh et al., 2020; Yildirim et al., 2022). The SB was cut into small pieces and dried, and subsequently crushed into particles using a disc mill machine. It was then sieved to pass through a No. 20 mesh. CF with a diameter of < 0.5 mm was cut to a length of approximately 10 mm. Furthermore, the SB and CF were soaked in 5% NaOH for four hours, then neutralized with water and dried in an oven at 80°C until they reached a moisture content (MC) of 10%–15%.
The engineered wood in this study consisted of a mixture of SB and CF, along with a blend of matrix materials: TPS and PVAc. The samples were produced by varying the ratio of SB and CF volume, specifically 30:70, 50:50, and 70:30. Meanwhile, the matrix was prepared from a TPS and PVAc mixture with a ratio of 80:20. The fiber and matrix were mixed at varying ratios for the fabrication of the engineered wood: 30:70, 40:60, and 50:50. Table 2 illustrates the formulations of engineered wood based on SB and CF.
| Type code | Fibers | Fibers (wt%) | Matrix (wt%) | |
|---|---|---|---|---|
| SB (wt%) | CF (wt%) | |||
| EW1 | 30 | 70 | 30 | 70 |
| EW2 | 70 | 30 | ||
| EW3 | 50 | 50 | ||
| EW4 | 30 | 70 | 40 | 60 |
| EW5 | 70 | 30 | ||
| EW6 | 50 | 50 | ||
| EW7 | 30 | 70 | 50 | 50 |
| EW8 | 70 | 30 | ||
| EW9 | 50 | 50 | ||
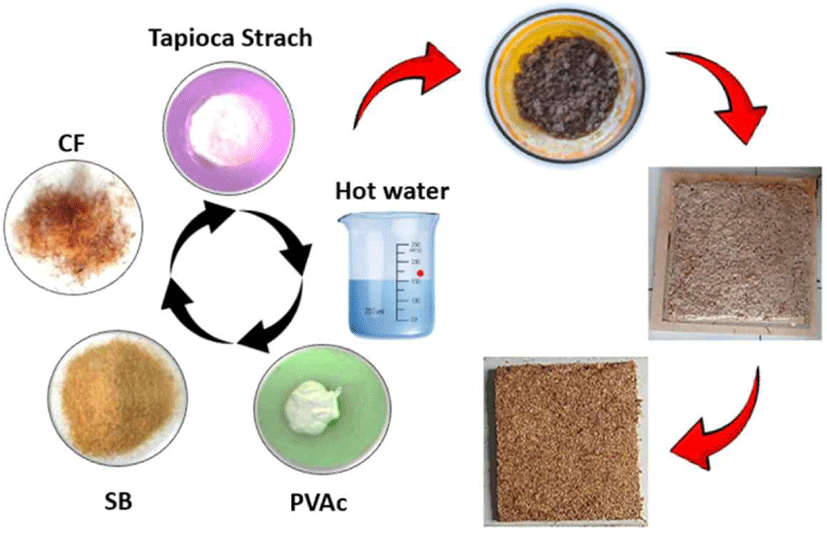
The process of forming engineered wood commenced with mixing SB, CF, and TPS. Then, the three materials were stirred with a mixer until a smooth mixture was achieved. The PVAc was dissolved in hot water and subsequently added to the fiber mixture. Furthermore, the mixture was subjected to thorough stirring until it reached a homogeneous consistency. Subsequently, the resulting mixtures were poured into molds with dimensions of 300 mm × 300 mm × 10 mm. In this study, the engineered wood was manufactured with the objective of achieving a target density of 0.4 g/cm3. The manufactured engineered wood was conditioned in a dry room with 65% relative humidity for a period of fourteen days prior to being utilized for testing. Fig. 1 illustrates the scheme of the SB/CF engineered wood manufacturing process.
The bending strength of the engineered wood were evaluated through the implementation of three-point bending tests, conducted at room temperature with a crosshead speed of 2 mm/min. The Tensilon Universal Testing Instrument Model RTF 1350 (A&D Company, Tokyo, Japan) was utilized for this purpose. The bending strength of the engineered wood were tested using a span of 100 mm, in accordance with the standard ASTM D790 (ASTM, 2003). At least five tests were conducted for each sample, for each engineered wood type, in order to ascertain the bending modulus of rupture (MOR) and bending modulus of elasticity (MOE). The average value was calculated from five specimens to represent each test result. The bending strength of the engineered wood was determined using the following Equations (1) and (2).
In this equation, P represents the load, L denotes the support span, b signifies the width, d stands for the depth of the samples, and y is the deflection.
Thermal conductivity testing of engineered wood was conducted using a Quick Thermal Conductivity Meter, QTM-500, Japan. Samples of dimensions 100 mm × 50 mm × 20 mm were prepared for the test and placed on the machine’s probe. The test employed the use of a hot wire at a temperature range of 22°C–25°C with a humidity level of 60%–65%. The sample was placed in a specimen box, and the probe was affixed to the surface of the sample to reach an equilibrium temperature. The current was set to 1 A and the measurement results were displayed on the device screen after a 60-second waiting period.
A Shimadzu thermal analyzer model DTG-60 (Shimadzu, Kyoto, Japan), in accordance with the ASTM E1131-08 standard, was employed to examine the thermal stability of the engineered wood. The samples, with an approximate weight of 5 mg, were subjected to a heating process from 30°C to 700°C under nitrogen at a heating rate of 40°C/min.
Five specimens were prepared with the size of 50 mm × 50 mm × 10 mm for the MC and thickness swelling tests. Moisture content testing begins with the weight of the specimen. The specimen shall be put into the oven and kept at a temperature of 103 ± 2°C. The mass (mo) when the test piece reaches the constant weight shall be measured, and the MC shall be calculated by Equation (3).
Here, mo refers to the weight (g) of the specimen 24 hours after being dried, and m1 to the weight (g) of the specimen before being dried.
For the thickness swelling test, before tests, the thickness of the specimen was measured, and then the measurement was conducted again after the immersion process was completed for 24 h. Equation (4) was used to determine the thickness swelling.
Here, t1 refers to the thickness (mm) of the specimen before immersion in water, while t2 refers to the thickness (mm) of the specimen after immersion in water
3. RESULTS and DISCUSSION
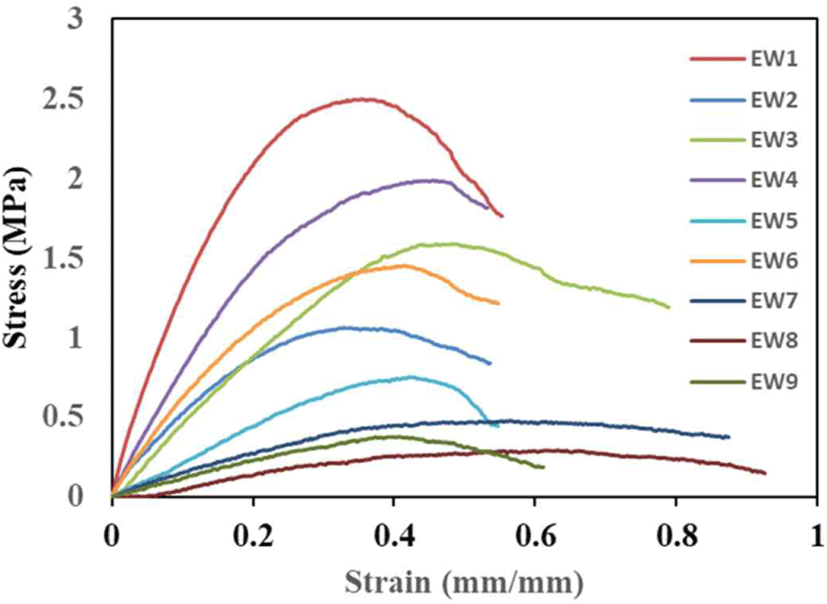
Fig. 2 illustrates the stress-strain curves of various engineered woods subjected to three-point bending loads. Each curve represents a specimen of a different type. Specimens with higher curves exhibited greater resistance to bending stress prior to failure. In contrast, lower and broader curves indicate reduced deformation capacity and strength. The EW1 curve demonstrated the highest maximum stress compared to other specimens, reaching approximately 2.8 MPa at a strain of approximately 0.25 mm/mm. This curve exhibited a distinctive characteristic with a rapid increase in stress to the peak.
Moreover, Fig. 3 illustrates the impact of varying the ratio between reinforcing fibers (SB and CF) and the matrix on the MOR and MOE of engineered wood. It can be observed that an increase in the ratio of CF to matrix resulted in a reinforcing effect on the engineered wood. The MOR of the engineered wood specimens with fiber and matrix ratios of 30:70, 40:60, and 50:50 ranged from 1.14–2.47 MPa, 0.75–1.99 MPa, and 0.29–0.44 MPa, respectively. Among the different SB and CF reinforced engineered woods under study, sample EW1 exhibited the highest MOR. A similar pattern was observed in the MOE of SB and CF reinforced engineered woods. Samples EW1, EW4, and EW5 exhibited the highest MOE at each fiber-to-matrix ratio, with values of 124.32 MPa, 119.42 MPa, and 107.88 MPa, respectively. Conversely, the EW2, EW5, and EW7 samples, which were filled with 30% CF, exhibited the lowest values, with MOE of 118.88 MPa, 105.28 MPa, and 92.66 MPa, respectively. Based on JIS A 5905-2003 (Japanese Industrial Standards, 2023) the MOR value of engineered wood that meets the standard for insulation fibreboards classification was EW1, EW2, EW3, EW4, and EW6.
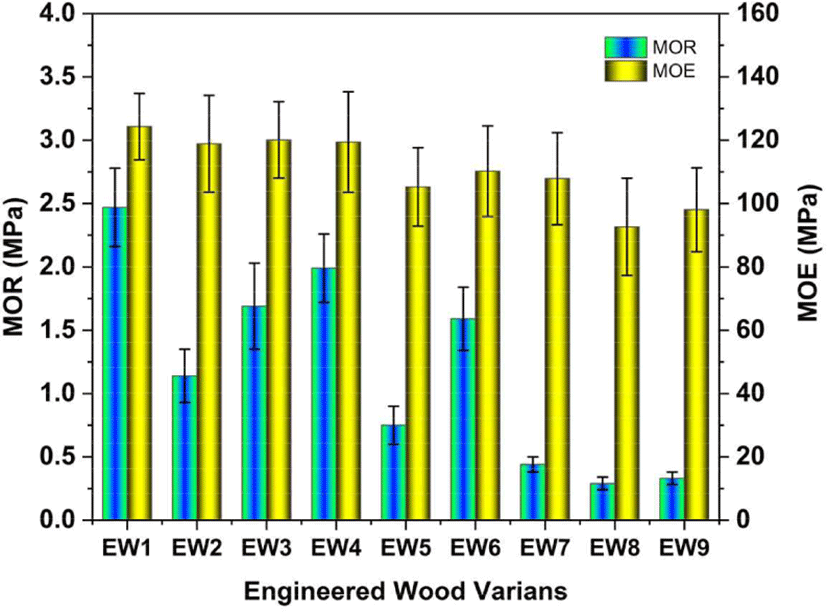
The results of the study indicated that the proportion of reinforcing CF and matrix had a significant impact on enhancing the bending properties of engineered wood. The preponderance of CF as a reinforcement contributed significantly to the improvement of the MOR and MOE of engineered wood. CF, which has better mechanical properties than SB, enhances the material’s resistance to bending loads. Conversely, reducing the matrix proportion tends to diminish bending strength. When the matrix is insufficient to effectively bind the fibers, bending properties are compromised. However, excessive reinforcement without adequate matrix support actually impairs mechanical performance, indicating the importance of an optimal balance between matrix and reinforcement in engineered wood design. The independent-sample t-test shows a significant relationship between constituent material engineered wood on MOR (Table 3). However, SB fibre has no significant relationship with MOR (Table 4).
| Subject effects | df | t-value | Sig. (2 tailed) |
|---|---|---|---|
| Matrix | 2 | 4.506 | 0.003** |
| SB/CF fiber | 7 | 2.310 | 0.054* |
| Subject effects | df | t-value | Sig. (2 tailed) |
|---|---|---|---|
| SB | 2 | 0.597 | 0.658 |
| CF | 1 | 19.638 | 0.032* |
This result is consistent with those reported in previous studies by other researchers. In a similar vein, Susilawati et al. (2021) evaluated the influence of coconut fiber and Terminalia catappa fruit fibers, utilizing a PVAc matrix, on the mechanical properties of biocomposites. The mechanical properties of the biocomposites were observed to increase in conjunction with an increase in the quantity of CF. The sample containing a CF concentration of 70% exhibited maximum mechanical properties. Previous studies have indicated that fiber hybridization, fiber loading, and the proportional matrix ratio can enhance MOR (Mawardi et al., 2021; Tigabe et al., 2022). These findings suggest that the type of fiber and the ratio of fiber to matrix are directly proportional factors that significantly influence the bending properties of composites. The type of fiber, matrix, and fiber stiffness can affect the modulus of biocomposites (Ramlee et al., 2019). Additionally, research conducted by Mawardi et al. (2024) found that increasing the styrofoam matrix in bagasse fiber composites improved the bending modulus of the material.
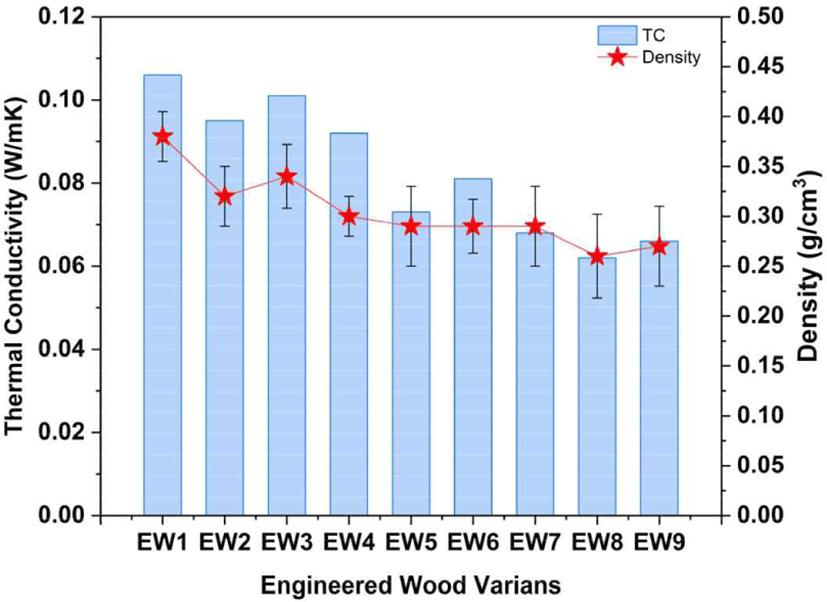
The coefficient of thermal conductivity of materials is a critical factor in determining their suitability for use as thermal insulation. The transfer of heat is more rapid through materials with higher conductivity. Conversely, materials with lower conductivity are more suitable for use as building insulators or in engineered applications. Fig. 4 illustrates the thermal conductivity of different SB and CF based engineered wood. Fig. 4 depicts the experimental results of the thermal conductivity of engineered wood in ratios of 30:70, 40:60, and 50:50. It is evident that the engineered wood in the ratio 50:50 exhibited a lower thermal conductivity within the range of 0.062 to 0.068 W/mK. The sample with the lowest thermal conductivity coefficient, 0.062 W/mK, was represented by EW8 engineered wood. The results demonstrated that the ratio of 70% SB, 30% CF, and an equal combination ratio of fiber and matrix (50:50) exhibited lower thermal conductivity and density.
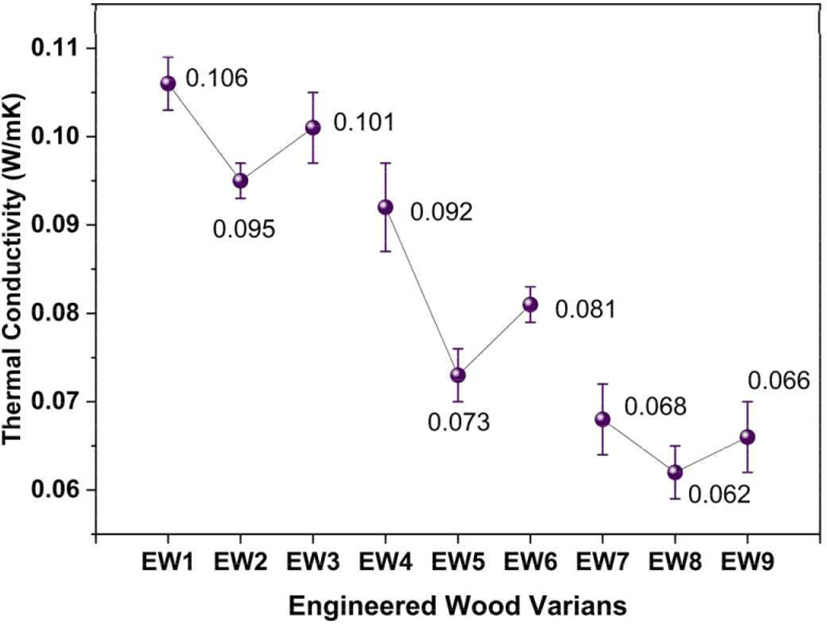
Furthermore, the thermal conductivity performance of engineered wood exhibited a correlation with density (Fig. 5). The thermal conductivity of engineered wood was found to be related to its density. The produced material exhibited a low density, with a range of 0.26 to 0.38 g/cm3. An increase in density is associated with an increase in thermal conductivity. As the density of engineered wood increases, the proportion of solid material rises, while the number of voids decreases. This phenomenon is most likely attributed to the morphology of the fibers, as demonstrated by the lower density and lighter weight of SB compared to CF. Moreover, voids serve as scattering centers for phonons and absorb a minor portion of the material’s heat conduction capacity, resulting in reduced thermal conductivity (Thoemen and Humphrey, 2007). Ramlee et al. (2021b) discovered that the incorporation of an increased quantity of SB into biophenolic composites resulted in a reduction in thermal conductivity. In principle, the evaluation of thermal conductivity is of great importance in the production of insulation materials for buildings. Various factors, including the anatomical structure, density, and porous structure, contribute to high thermal resistance due to their low conductivity. Overall, engineered wood density values in this research met JIS A 5905 for insulation board types that require a density value of under 0.35 g/cm3 (Japanese Industrial Standards, 2023). The independent-sample t-test shows a significant relationship effect between MC and density on thermal conductivity (Table 5).
| Subject effects | df | t-value | Sig. (2 tailed) |
|---|---|---|---|
| MC | 2 | 2.336 | 0.052* |
| Density | 7 | 9.337 | 0.000** |
The TGA and DTGA were employed to analyze the thermal stability properties of all engineered wood. Fig. 6 presents the thermal stability curves of engineered wood with fiber-to-matrix ratios of 30:70, 40:60, and 50:50. The decomposition curve behavior of all engineered woods was found to be similar. In the TGA thermograms, three distinct zones of degradation were observed. In the first zone, a slight weight loss was noted, which was attributed to the removal of moisture from the sample. The mid-zone exhibited a significant weight loss due to the initiation of the thermal decomposition process, which was followed by the final zone, which represented the ultimate thermal degradation.

The initial degradation observed within the temperature range of 30°C–134°C resulted in weight loss of 9.65%, 6.48%, and 5.09% for the engineered wood with the respective ratios of 30:70, 40:60, and 50:50. This was caused by the evaporation of the water content within the matrix and fibers (Seo et al., 2019). A higher weight loss rate was observed in the second stage, which constituted the major degradation stage. Significant degradation occurred in the temperature range of 288°C to 389°C, resulting in a weight loss of approximately 51.42% for the sample with a 30:70 ratio [Fig. 6(a)]. In the temperature range of 283°C to 388°C, a weight loss of 54.93% was recorded for the sample with a 40:60 ratio [Fig. 6(b)]. Finally, in the temperature range of 274°C to 385°C, a weight loss of 46.46% was observed for the sample with a 50:50 ratio [Fig. 6(c)]. This weight loss was attributed to the degradation of the fibers, the release of carbon dioxide and water, as well as the decomposition of TPS. The initial temperature decline in this stage is indicative of the material’s thermal stability (Abral et al., 2018). In this stage, the main degradation occurred at temperatures of 339°C, 337°C and 331°C for samples with 30:70, 40:60, and 50:50 ratios, respectively. The remaining portion of the product exhibited further degradation at 600°C, with the final degradation occurring at a higher temperature. It was observed that the ratio of the matrix affected the thermal stability of the engineered wood.
Engineered wood’s MC is essential, especially when using natural fibers. Fig. 7 shows the percentage of MC and thickness swelling of engineered wood after immersion in water for 24 hours. The MC percentage for all samples ranged from 10.24% to 12.85%. Sample EW8 had the highest MC at 12.85%, while EW5 and EW2 had MC percentages of 11.94% and 10.87%, respectively. Overall, the MC of the engineered wood produced met the JIS A 5905-2003 standard, which specifies a range of 5% to 13% (Japanese Industrial Standards, 2023). Fig. 7 shows that the MC percentage increased as the percentage of SB increased and the matrix ratio decreased. The influence of hydroxyl groups in natural fibers, such as CF and SB, is responsible for the higher rate of water absorption. As CF increased, the number of hydroxyl groups in the engineered wood decreased, reducing moisture absorption. This finding aligns with research conducted by Mawardi et al. (2024), which found that the MC of the core layer and blockboard based on bagasse fiber increases with an increase in bagasse fiber.
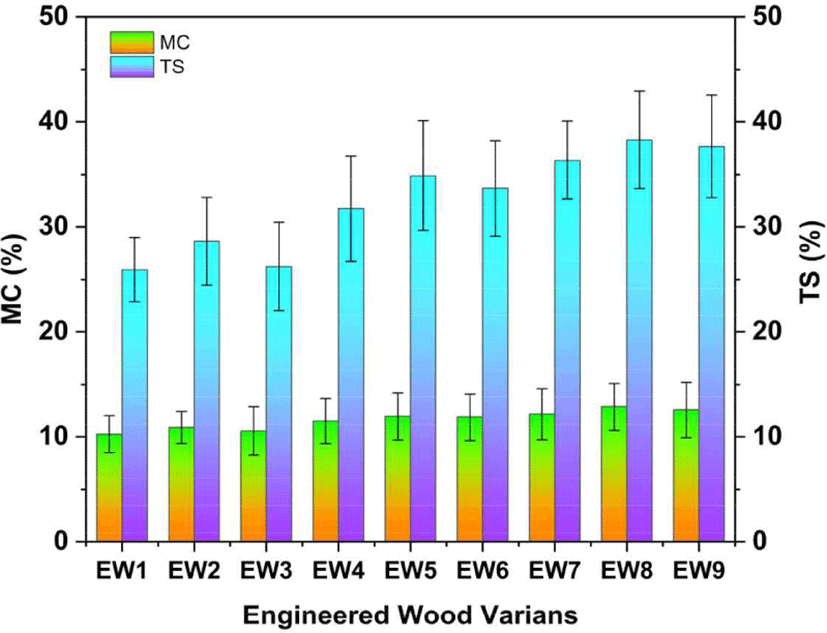
Furthermore, water absorption affects the thickness swelling of engineered wood. This study showed that after 24 hours of immersion, the highest TS was 38.26% for EW8, followed by EW5 at 34.88%, and EW2 at 28.62%. These samples exhibited the worst dimensional stability among all the boards in their respective groups. In contrast, engineered wood EW1 performed the best, with a value of 25.92%. The study found that the TS value decreased as the percentage of CF in the engineered wood increased. The density of the engineered wood-forming constituents influences the TS capacity, as CF fibers have a higher density (1.25–1.5 g/cm3) compared to SB fibers (0.4–0.55 g/cm3). Additionally, the matrix ratio positively impacts the reduction of TS in engineered wood. A higher matrix ratio improves the contact between fiber and matrix, making it difficult for water to penetrate between the fibers. The effect of the matrix covering the surface of the layer in forming the engineered wood also helps protect against water penetration into the board. Based on the JIS A 5905-2003 standard for insulation board, none of the engineered wood variants produced met the TS requirement of 10% or under (Japanese Industrial Standards, 2023).
In natural fiber composites, reducing the thickness swelling value is an essential challenge because this property affects the dimensional stability and long-term performance of the composite, especially in humid environments. In this study, the high-thickness swelling is inseparable from the hygroscopic properties of bagasse and CF, plus the use of TS as a matrix that tends to absorb water easily. However, several approaches that can be considered to reduce the thickness swelling value include coating the fiber with wax or resin to reduce water absorption and the use of compatibilizer and coupling agents such as maleated polypropylene and organosilanes or isocyanates to improve adhesion between natural fibers and the polymer matrix. Good adhesion will prevent absorbing water.
4. CONCLUSIONS
Lightweight engineered wood produced from derived SB and CF was prepared and characterized. The density, MOR, and MOE of the engineered wood were found to range between 0.26 and 0.38 g/cm3, 0.29 and 2.47 MPa, and 92.66–124.32 MPa, respectively. The sample EW1 exhibited the highest MOR, with a value of 2.47 MPa. The sample EW8 exhibited the lowest thermal conductivity value of 0.062 W/mK, and the TGA analysis observed a thermal stability temperature of up to 288°C. An increase in the proportion of CF content and the TPS/PVAc matrix in the engineered wood led to a positive outcome in terms of density, bending strength properties, increased stability, and thermal resistance. This study indicates that SB- and CF fiber-based engineered wood may serve as potential alternatives for environmentally friendly and sustainable thermal insulation materials.

