1. INTRODUCTION
Owing to climate change and global warming, interest in timber structures has increased because of their sustainability and decreased carbon emissions compared to other building materials (Cha et al., 2022; Hwang et al., 2022; Kang et al., 2023; Lee and Oh, 2023; Oh, 2022; Oh et al., 2023; Ozdemir et al., 2023). In particular, cross-laminated timber (CLT), an engineered wood panel, is widely used in mid- and high-rise timber buildings because of its mechanical properties and applicability in prefabrication (Ha et al., 2023; Kim et al., 2024; Song and Kim, 2022, 2023; Trisatya et al., 2023).
One issue with mid- and high-rise buildings is their resistance to lateral forces caused by wind or earthquakes (Lee and Jang, 2023). Structural analysis simulations that require in-plane shear properties as input data are necessary for designing tall buildings to model the behaviors of shear walls and diaphragms. When CLT are used for shear walls or diaphragms, the in-plane shear modulus is an important property (Berg et al., 2019; Lukacs et al., 2019). Therefore, a method to measure the in-plane shear stiffness of CLT is required.
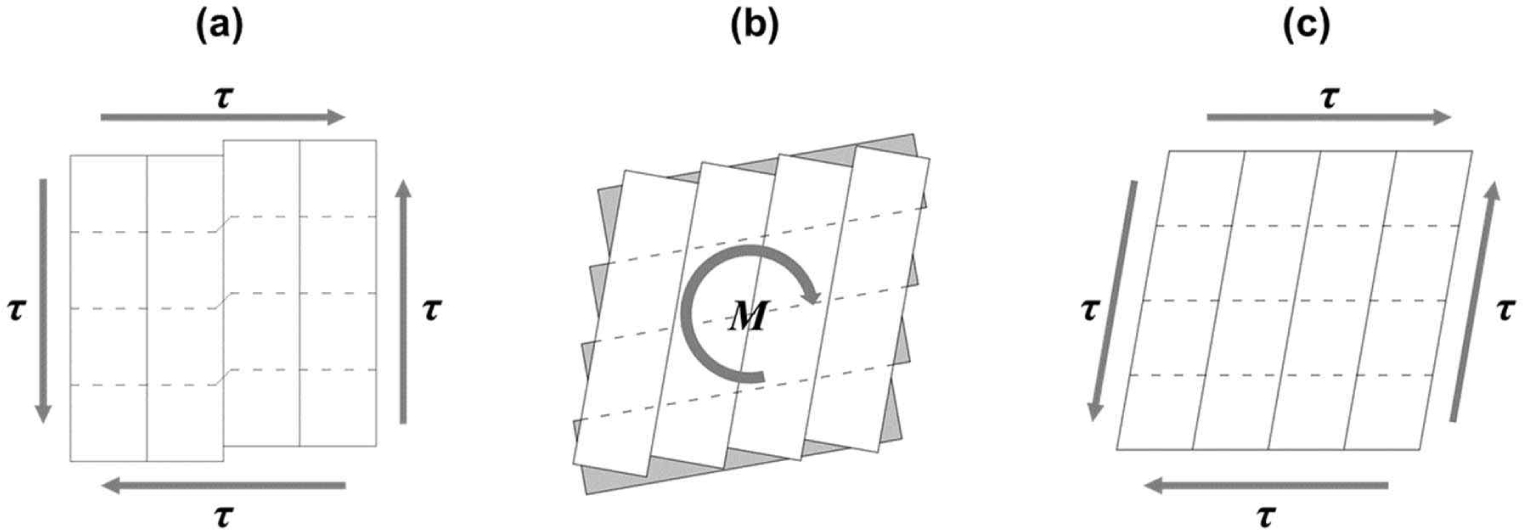
The in-plane shear behavior of CLT can be distinguished by three principal mechanisms: net shear, torsional shear, and gross shear, as illustrated in Fig. 1 (Bogensperger et al., 2007; Brandner et al., 2013; Flaig and Blaß, 2013). Several studies have investigated these mechanisms through single-node tests using small specimens (Brandner et al., 2013; Jöbstl et al., 2008; Wallner, 2004). However, while the single-node test is suitable to analyze the failure modes of small specimens, this method is inappropriate to represent the in-plane shear behavior or evaluate the in-plane shear modulus of a full-scale CLT panel (Andreolli et al., 2014; Björnfot et al., 2017). Even if the in-plane shear modulus of CLT could be measured using small specimens, a verification method is necessary to ensure that this value is applicable to large CLT panels. Therefore, to properly evaluate the in-plane shear modulus of the CLT, large-scale test of CLT panels have been conducted.
Using large-scale CLT panels, various methods for evaluating the in-plane shear properties have been proposed, such as column compression, diagonal compression, double shear, and picture frame, as shown in Fig. 2 (Andreolli et al., 2014; Berg et al., 2019; Björnfot et al., 2017; Bogensperger et al., 2007; Bosl, 2002; Brandner et al., 2013; Dujic et al., 2007; Gubana, 2008; Kreuzinger and Sieder, 2013; Turesson et al., 2019a, 2019b).
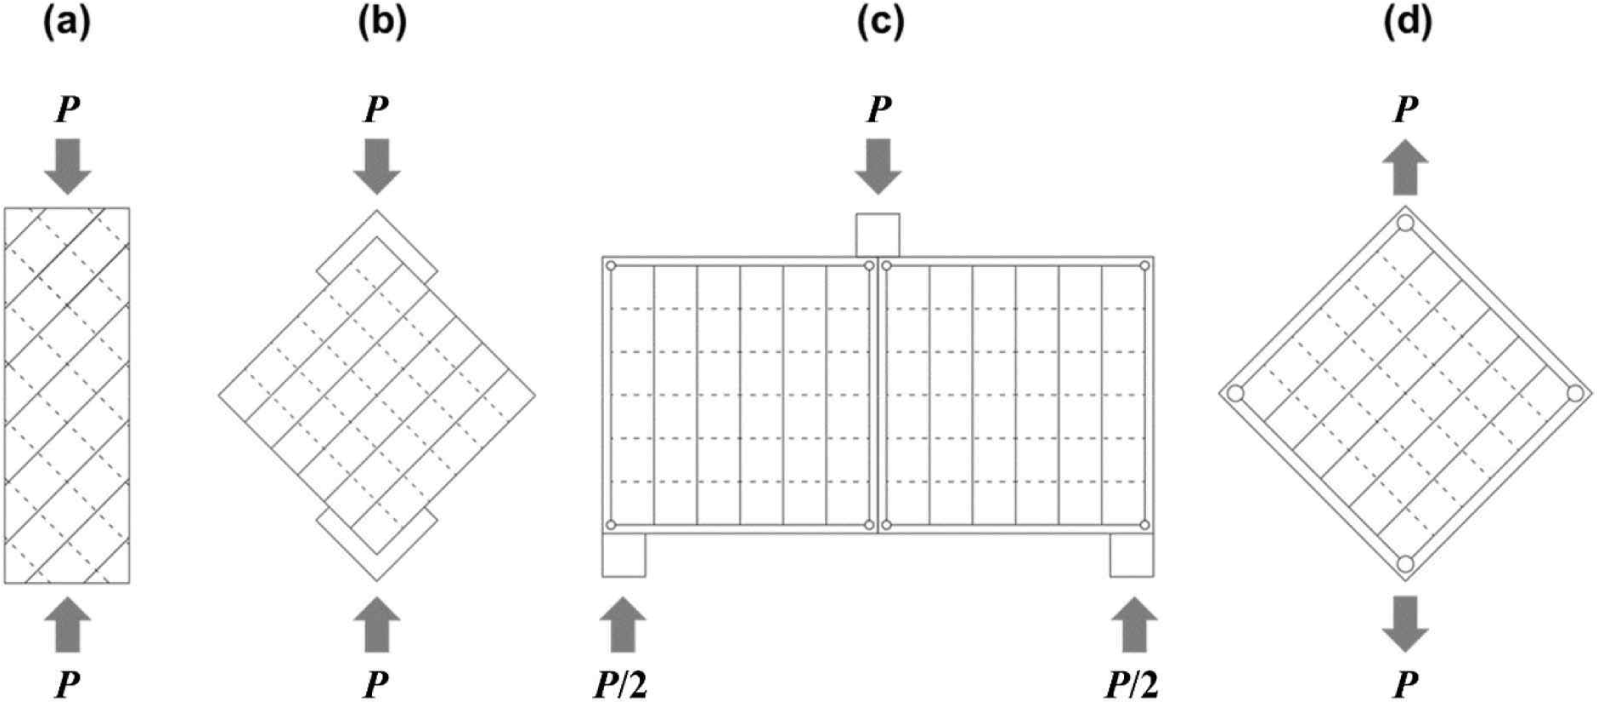
Kreuzinger and Sieder (2013) proposed the column compression method to evaluate the in-plane shear modulus of the CLT panel [Fig. 2(a)], whereas Andreolli et al. (2014) and Dujic et al. (2007) proposed the diagonal compression method [Fig. 2(b)]. The column compression and diagonal compression methods use only compressive load to create the shear stress in the specimen. In these methods, the CLT specimen is installed at an angle of 45°, and the compressive stress acts as a shear stress. However, compressive stress exists in the specimen in addition to shear stress. Therefore, it has been argued that a pure-shear state was not achieved. Turesson et al. (2019b) reported that these methods might overestimate the in-plane modulus of the CLT owing to the nonuniform shear deformation of the panels. In the double shear method proposed by Bogensperger et al. (2007) [Fig. 2(c)], the stress state of the specimen could not be considered as a pure shear state because a moment occurred in the specimens owing to the load introduction. Since the in-plane shear modulus should ideally be evaluated in the pure shear state, a method that can introduce pure shear in the test specimen is required.
The picture frame method uses several steel frames that are connected to each other by a pin joint, and transfers the load to the specimen using friction, glue, dowels, and bolts (Björnfot et al., 2017; Bogensperger et al., 2007; Bosl, 2002). Turesson et al. (2019b) reported that the difference in deformation between the compressive and tensile directions in the picture frame method was smaller than that in the diagonal compression method because the picture frame can apply compressive and tensile stresses to the specimen simultaneously. This indicates that the stress induced by the picture frame method is closer to the pure shear state than those induced by the other methods. Turesson et al. (2019b) reported that the picture frame method is a testing method that can be used to achieve an approximation of a pure shear state.
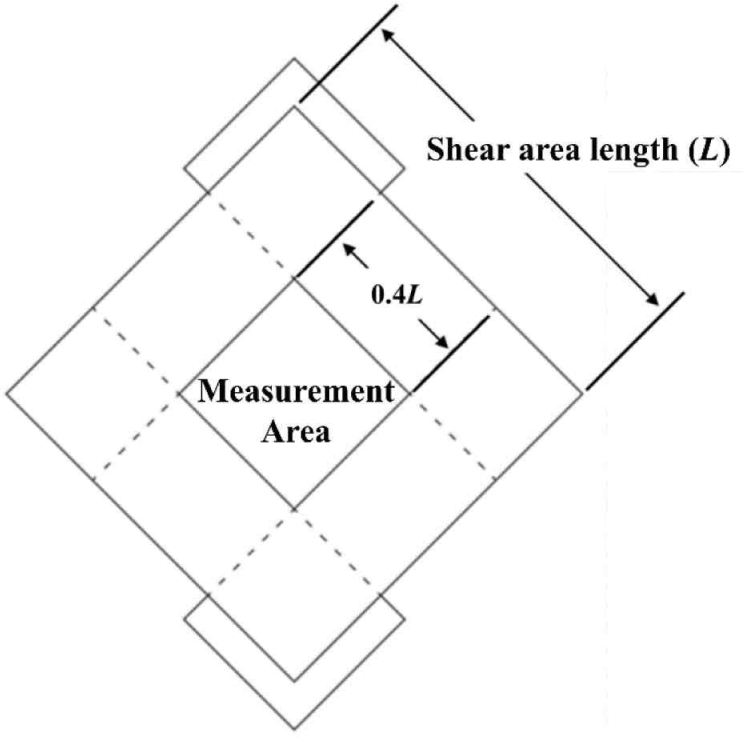
However, the picture frame method involves a deformation measurement area. The deformation measurement area is the region where the deformation of the specimen is measured using a displacement transducer. Because stress concentration could occur near the connections between the picture frame and the test specimen, a pure shear state may not occur in the entire area of the test specimen. Andreolli et al. (2014), Berg et al. (2019), Björnfot et al. (2017), and Turesson et al. (2019b) set the deformation measurement area length to 0.4 times the specimen side length (Fig. 3), and Bogensperger et al. (2007) reported that a large measurement area could lead to an inaccurate estimation of the shear modulus. Thus, a discussion of the measurement area of the picture frame method is required.
Another issue with the picture frame method is the loading protocol used. Berg et al. (2019), Björnfot et al. (2017), and Turesson et al. (2019b) applied preloading to minimize the effect of fastener tolerance, which reduced the difference between the tensile and compressive directions in subsequent loading phases. However, loading protocols varied across these studies. Therefore, in addition to the measurement area, the loading protocol must also be examined.
This study investigated test method for the in-plane shear modulus of CLT, particularly the measurement area and loading protocol. The measurement area and loading protocol were determined by tests on an acrylic sheet and plywood panel, which are relatively isotropic materials compared to CLT. The test methods were then verified using a CLT panel. Based on these results, KS F 2082 (Korean Standards Association, 2023), a test standard to evaluate the in-plane shear modulus of CLT, was issued in 2023. This study supported the KS committee by providing research evidence.
2. MATERIALS and METHODS
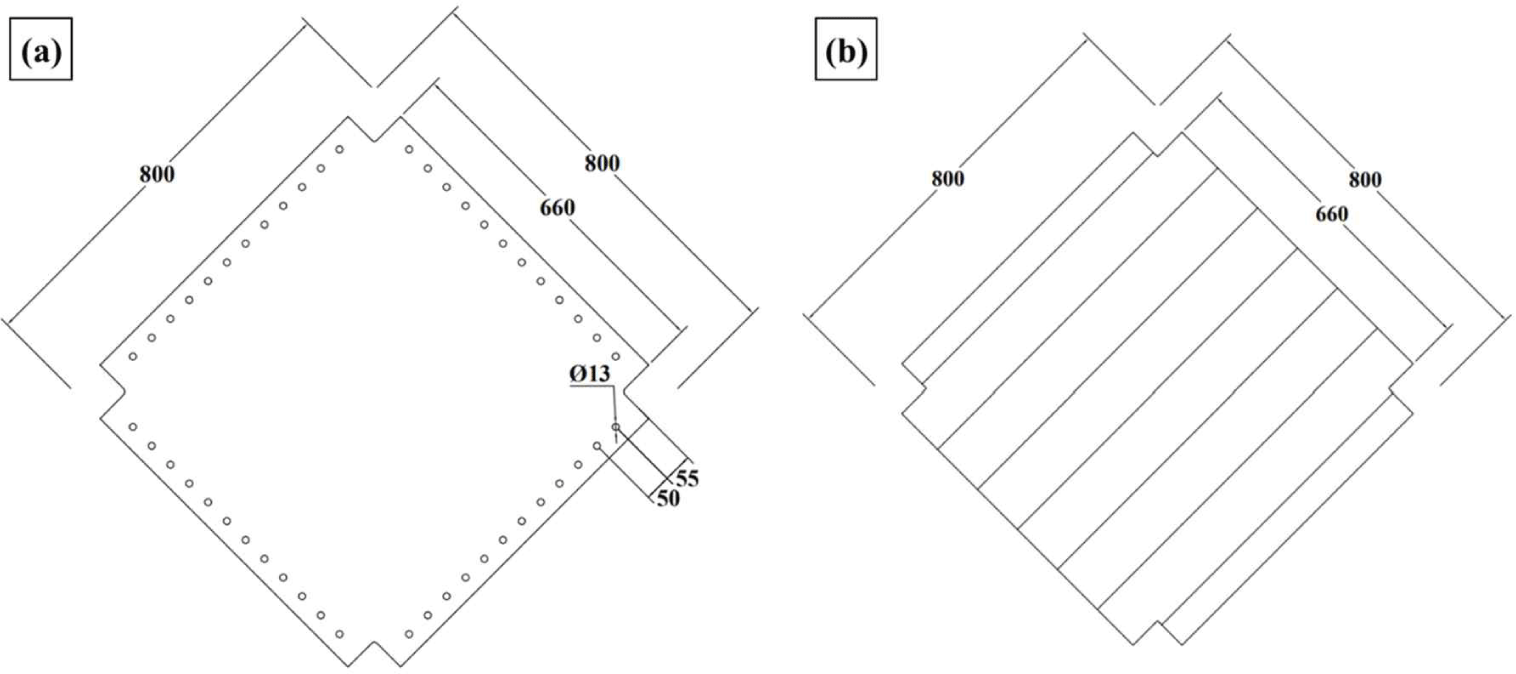
To determine the measurement area, a preliminary test was conducted using a 20 mm-thick acrylic sheet (ClearWhite; AltuglasTM, Paris, France). An acrylic sheet was considered because it is a more isotropic material than CLT. A 24 mm thick structural plywood panel was used to determine the optimal loading protocol. The grade of the plywood panel was class 1, according to KS F 3113 (Korean Standards Association, 2021), and was composed of nine layers of Japanese Larch (Larix kaempferi carr.; Sun & L, Incheon, Korea). The configurations of the acrylic sheet and plywood panel are shown in Fig. 4(a). The corners and holes were cut using a CNC machine with a 1 mm tolerance for mounting and demounting the bolts and dowels. The CLT panel was composed of Japanese Larch (L. kaempferi carr.) and glued using Phenol-Resorcinol Formaldehyde resin without edge gluing. It was 140 mm thick and had five layers. The configurations of the acrylic sheet and the plywood panel are shown in Fig. 4(b). The density of the CLT panel was 568 kg/m3 and the moisture content was 11.87%. The acrylic sheet, plywood panel and CLT panel were each tested once.
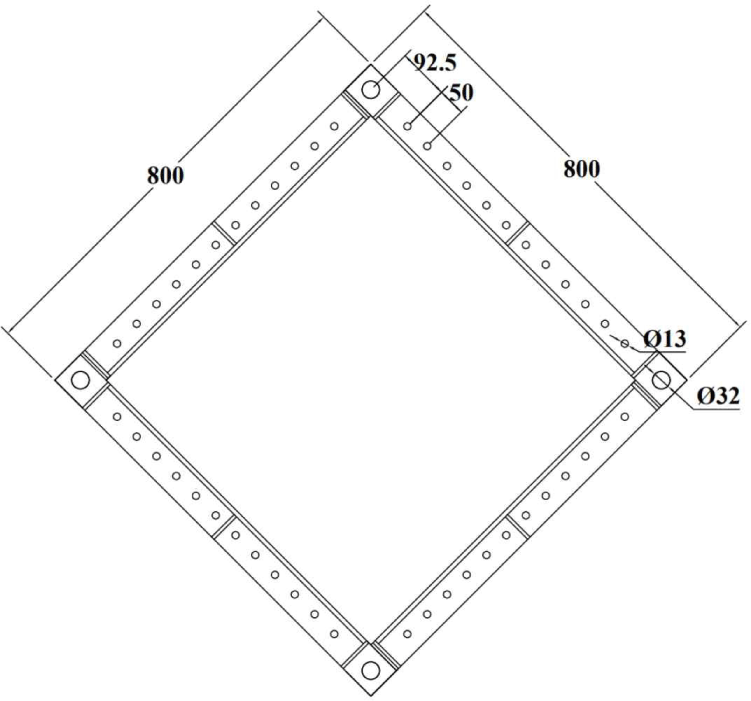
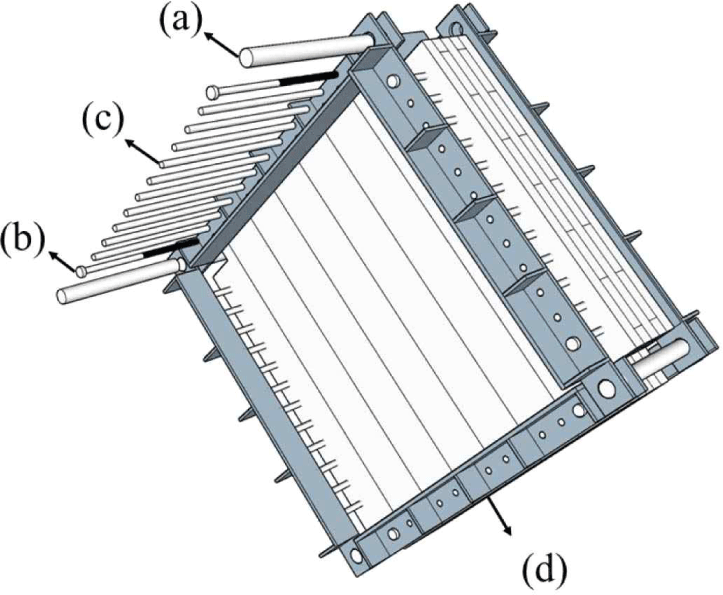
The picture frame was designed as described by Björnfot et al. (2017) and Turesson et al. (2019b). The dimensions and configuration of the picture frame are shown in Figs. 5 and 6. It consisted of eight L-shaped steel beams with four beams per side. The thickness of the L-shaped beams was 14 mm. The L-shaped beams were made of SS315 grade steel (Korean Standards Association, 2018), with a yield strength of 315 MPa. The holes for the panel fasteners were drilled with a 1 mm tolerance, and the holes for the frame connecting dowels were drilled with a 2 mm tolerance. To prevent splitting, the spacing between the holes was designed to be larger than four times the hole diameter, following KDS 41 50 30 (Ministry of Land, Infrastructure and Transport, 2022). The diameter of the dowel assembled between the L-shaped beams was 30 mm, and its tensile strength was 600 MPa. The specimens were mounted on the picture frame using dowels and bolts of 12 mm diameter. Eight bolts were used to prevent the picture frame from separating during the test (Fig. 6). When a tensile load was applied to the picture frame, this load was transferred to the test specimen by the picture frame and fasteners.
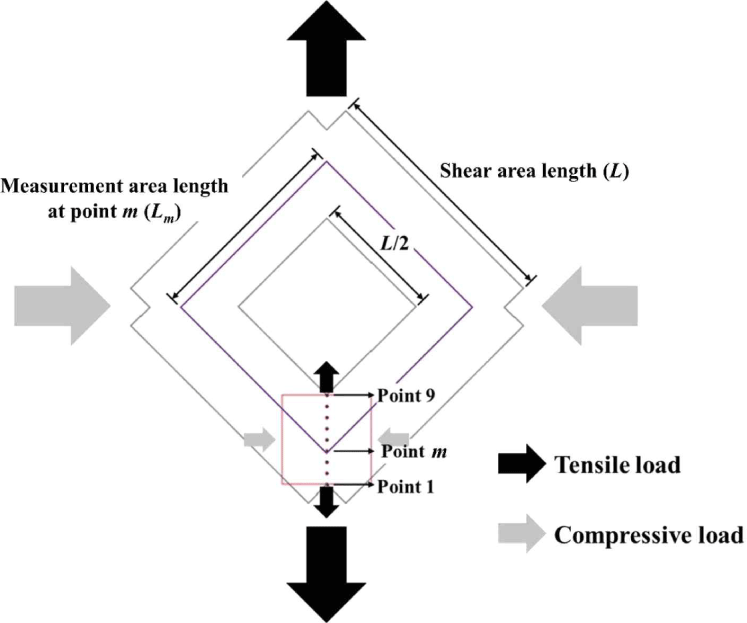
To determine the area where a pure shear state occurred, the shear behavior of the acrylic sheet was investigated at nine distinct points using a digital image correlation (DIC) device (ARAMIS Adjustable, OMA, Daejeon, Korea). Each point represented the measurement area and was chosen at the same interval in the range of 50%–100% of the shear area length, as shown in Fig. 7. The load was applied using a Universal Testing Machine (Model 5585, Instron, Norwood, MA, USA). The loading rate was 2.33 mm/min, according to Equation (1) (ASTM, 2019). When the load was applied, it was transmitted to the test specimen as tensile and compressive loads through the picture frame. Therefore, the area measured using the DIC experienced both tensile and compressive loads simultaneously. During loading, the tensile and compressive deformations at each point were measured, and the differences between the two deformations were evaluated. If the tensile and compressive forces were equal, this state could be considered as pure shear. The measurement area was defined as the region where the difference decreased by less than 10%.
Speed of the crosshead (mm/min) was defined as
Where Z: shear strain rate (mm/mm · min), normally taken as 0.005, L: shear area length (mm).
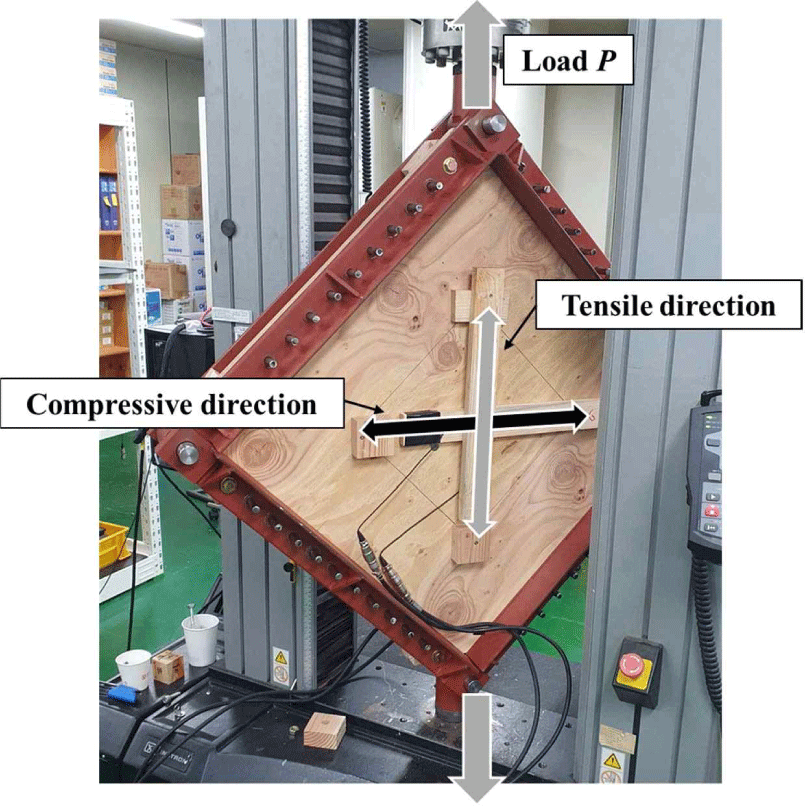
To verify the implementation of a pure shear state and determine the loading protocols, experiments were conducted on a more isotropic material. Tests were carried out on a plywood panel, which is known to be more isotropic than CLT. The deformation of the plywood panel was measured using CDP-10MT (Tokyo Sokki, Tokyo, Japan) displacement transducers with an accuracy of 0.001 mm. Two displacement transducers were placed on each side and the diagonal compressive and tensile deformations were measured. The measurement area length was set to 50% of the shear area length to avoid stress concentration that occurs near the connection between the specimen and picture frame (dowels and bolts). Fig. 8 shows the configuration of the plywood panel test. The Universal Testing Machine and loading rate were identical to those of the acrylic sheet. The loading protocol for the three-stage load phase included a two-step preload (Fig. 9). The preload was applied to settle the test specimen and prevent an unstable state during the initial stage. The first load phase was from 0 to 0.1 Pest, the second was from 0 to 0.3 Pest, and the third was from 0 to Pest.
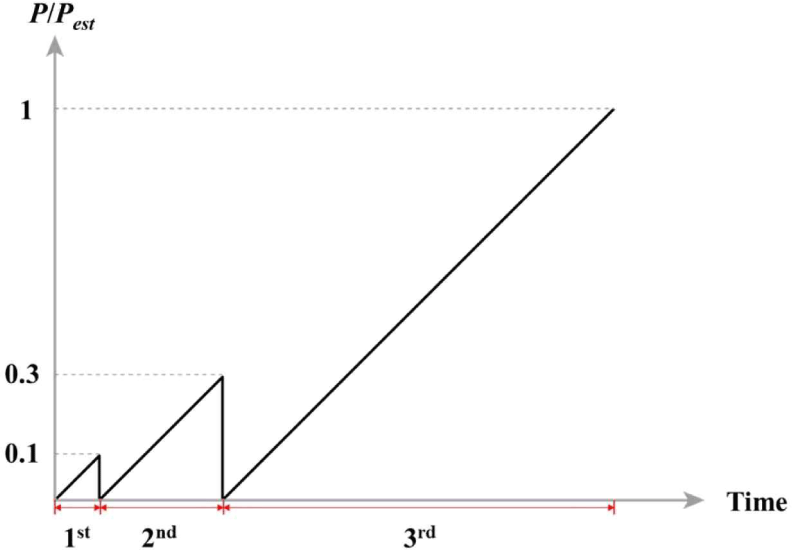
Where Pest: Estimated maximum load, which can be evaluated by a preliminary test or by the shear strength and area of the test specimen.
A CLT specimen was tested to verify the measurement area and the loading protocol determined in this study. The achievement of a pure shear state in the CLT specimens was examined from the test results. A formula for the in-plane shear modulus of CLT was derived. In-plane shear modulus G is defined as shear stress (τ) divided by shear strain (γ). Shear stress was determined using the shear force and shear area [Equation (2)]. The applied load, shear force, specimen thickness, and shear area length are shown in Fig. 10.
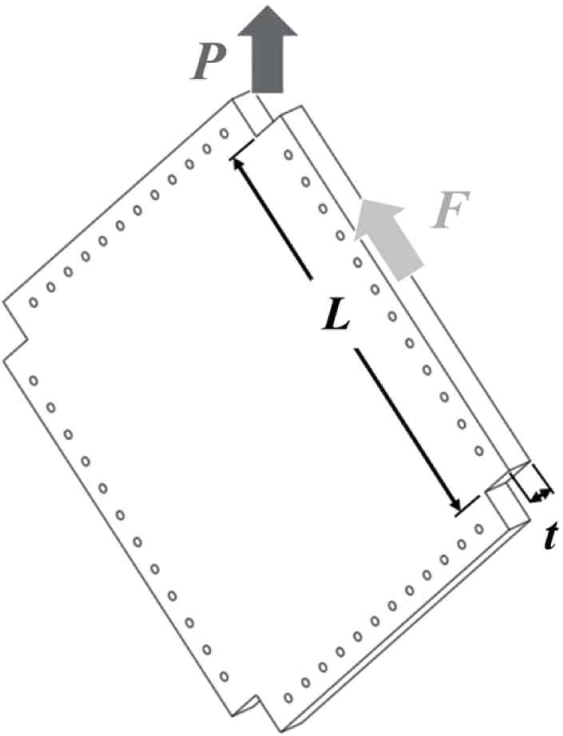
Where τ: shear stress (N/mm2), F: shear force (N), A: shear area (mm2), P: applied load (N), t: thickness of specimen (mm), L: shear area length (mm; Fig. 10).
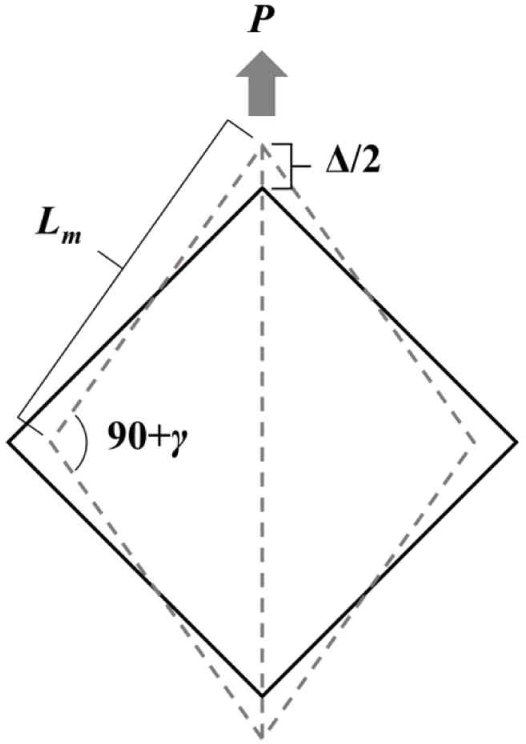
When a load (P) was applied to the panel, the measured area deformed, as shown in Fig. 11. Using the law of cosines, Fig. 11 can be described using Equation (3). The in-plane shear modulus can be calculated using Equations (3) to (6):
Where Lm: measurement area length (mm), Δ: deformation in diagonal (mm), γ: shear strain (rad), G: shear modulus (MPa).
Because the deformations were measured in the tensile and compressive directions, both directions must be considered when evaluating the in-plane shear modulus. Berg et al. (2019) and Turesson et al. (2019b) proposed a method that averages the slopes of the load-deformation curves in both directions instead of simply averaging the deformations to evaluate the in-plane shear modulus. Therefore P/Δ, which indicates the slope of the curve, was defined in Equation (7). In addition, Equation (6) is rewritten as Equation (8) by averaging the slopes in both directions. In KS F 2082, Equation (8) was proposed to evaluate the in-plane shear modulus of the CLT.
Where Δi: deformation in the i-direction (mm; i: compressive or tensile), ki: slope of curve in the i-direction (N/mm; i: compressive or tensile), kc: slope of the curve in the compressive direction (N/mm), kt: slope of the curve in the tensile direction (N/mm).
3. RESULTS and DISCUSSION
Fig. 12 shows that the difference between the tensile and compressive deformations decreases from the edge toward the center. Within 70% of the shear length (points 6–9 in Fig. 7), the difference between the tensile and compressive deformations is less than 10%. These results suggest that the in-plane shear modulus can be measured over a range greater than 40% of the shear length, as previously suggested (Andreolli et al., 2014; Berg et al., 2019; Björnfot et al., 2017; Turesson et al., 2019b). Conservatively, it is stipulated that the measurement area for determining the shear modulus should be set within a maximum of 50% of the shear length in the standardized test method in KS F 2082.
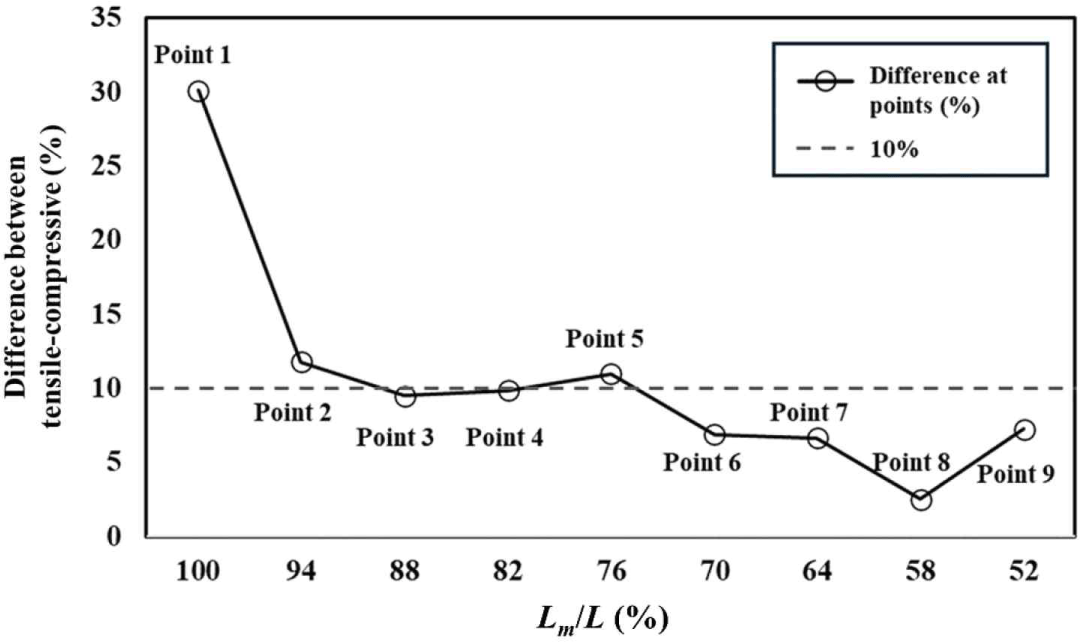
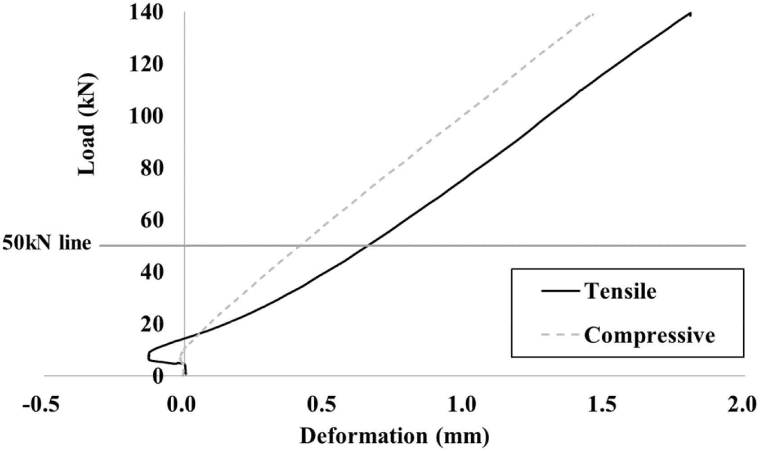
Fig. 13 shows the load-deformation curve of the acrylic sheet test. An unstable region was observed below the 50 kN load line, highlighting the need for preloading. The preloading phase stabilized the displacement transducer and connections between the picture frame and test specimen (Turesson et al., 2019b).
The plywood panel was therefore tested following the loading protocol of three-stage load phases. The first load phase was from 0 to 0.1 Pest, the second from 0 to 0.3 Pest, and the third from 0 to Pest (Fig. 9). The first and second load phases were used to stabilize the initial disturbance. An estimated maximum load of 257.6 kN was determined based on the shear area and shear strength of the plywood panel, using the test data of Riberholt (1984).
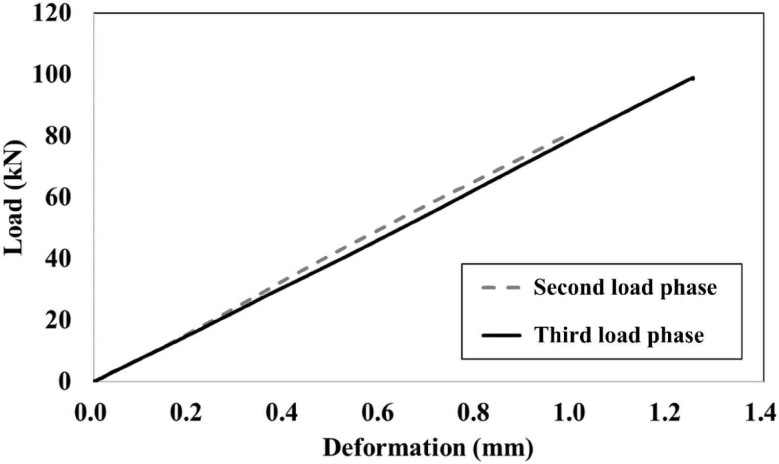
Fig. 14 shows the load-deformation curves of the plywood panel. In Fig. 14(b) and (c), the linearity of the load-deformation curve can be seen compared with Fig. 14(a), the first load phase. Because the load-deformation curves of the second and third load phases showed similar behaviors, the two curves were compared in Fig. 15. Each curve shows the average load-deformation curves of the second and third load phases, representing the mean values of the tensile and compressive curves. The load-deformation curve of the second load phase is seen to be very close to that of the third load phase.
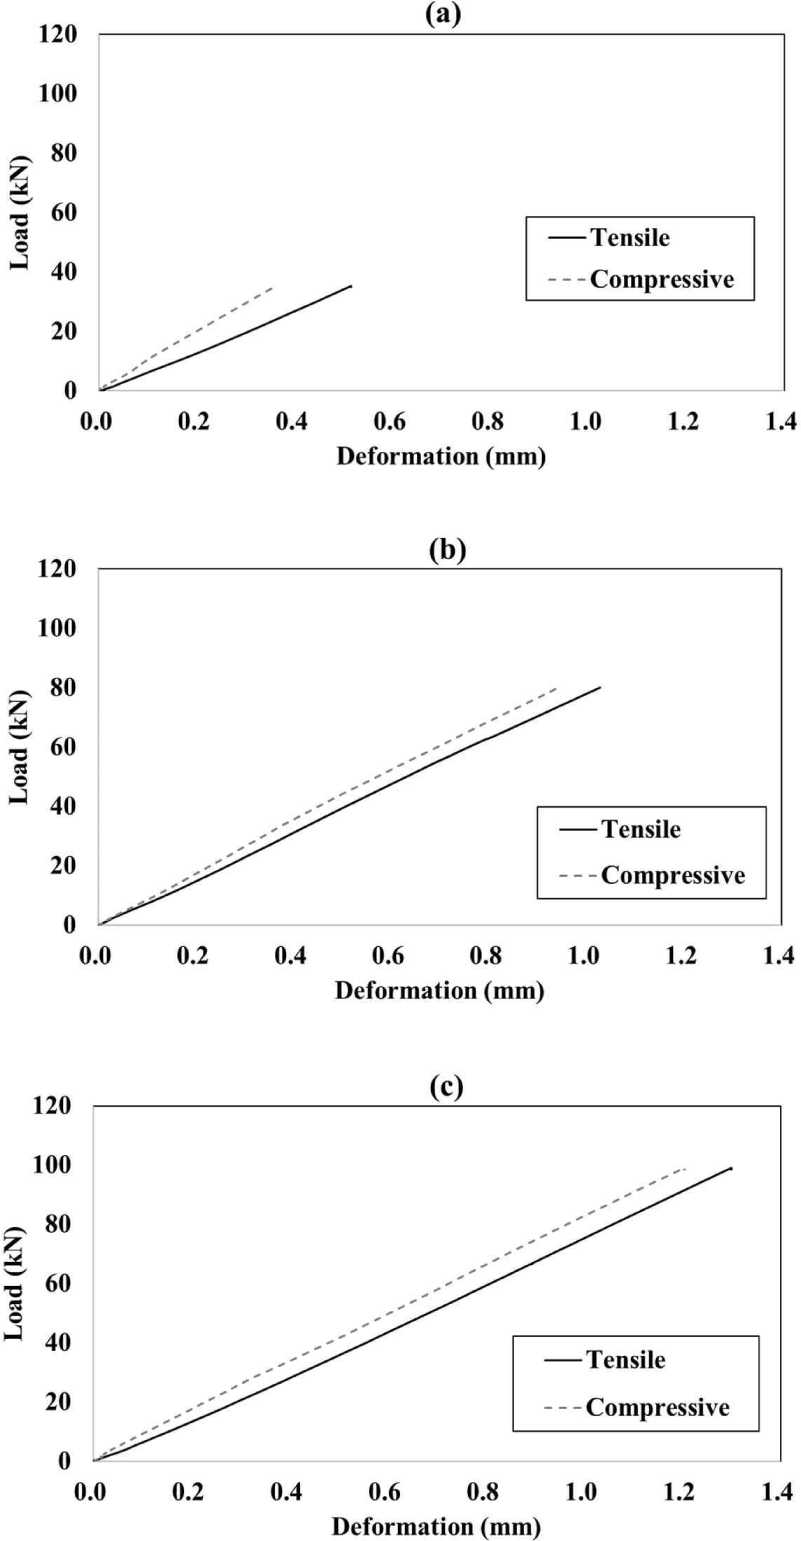
Table 1 lists the slopes of the curves of the plywood specimens at each loading phase. The slopes of the load-deformation curves in all regions were evaluated using the least-squares method. In the first load phase, the slopes in the tensile and compressive directions were significantly different (36.1%), and a smaller difference was observed in the higher-step load phase (second load phase, 8.0%; third load phase, 7.3%). In the first load phase, there was a difference between the compressive and tensile slopes because of the gap between the jig and test specimen. In the second load phase, the effect of the gap was significantly reduced. Considering the large difference between the tensile and compressive directions, a loading protocol that introduces at least one preloading stage with 10% of the estimated maximum load was proposed in KS F 2082.
| Load phase | Tensile (kN/mm) | Compressive (kN/mm) | Difference (%)1) |
|---|---|---|---|
| 1st | 68.0 | 97.9 | 36.1 |
| 2nd | 79.0 | 85.6 | 8.0 |
| 3rd | 76.2 | 82.0 | 7.3 |
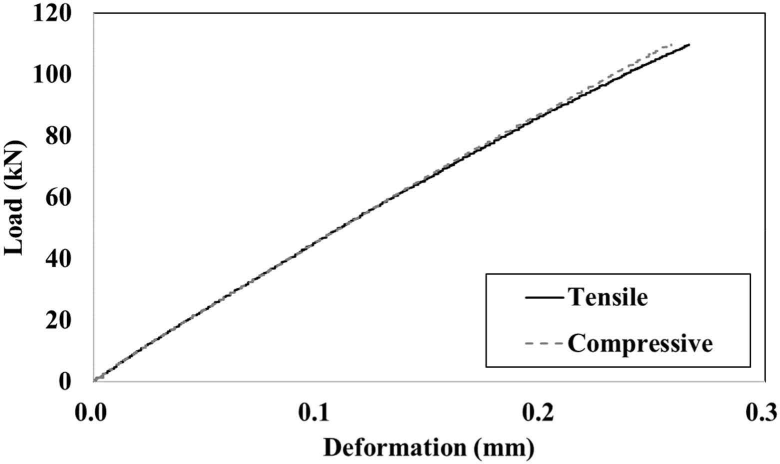
A CLT specimen was tested using the determined measurement area and loading protocol to verify the test procedure proposed in this study. The estimated maximum load was determined based on the shear area and shear strength of the CLT panel, using the test data of Gagnon et al. (2014). Fig. 16 shows the load-deformation curve of the CLT panel test after preloading. Similar behaviors were observed in the tensile and compressive directions in the measurement area. The slopes of the curves in the tensile and compressive directions are listed in Table 2. The difference between the tensile and compressive slopes was 2.0%, indicating that the experimental method presented in this study and KS F 2082 was applicable for generating a pure shear state and was also an effective experimental method for CLT. The in-plane shear modulus of CLT was evaluated using the formula derived in this study; the shear modulus of the CLT specimen was 693 MPa.
| Tensile slope (kN/mm) | Compressive slope (kN/mm) | Difference (%) |
|---|---|---|
| 404.2 | 396.3 | 2.0 |
4. CONCLUSIONS
In this study, the process of establishing a standard test method for the in-plane shear modulus of CLT, KS F 2082, was investigated. The picture frame method was selected as the test method because it could induce a pure shear state in the test specimen. Two parts of the test procedure were examined.
First, the measurement area was determined by using an acrylic sheet and DIC equipment. The difference between the compressive and tensile deformations was measured at nine points representing 50%–100% of the shear area length. When the measurement area length was less than 70% of the shear area length, the difference between the tensile and compressive deformations decreased to less than 10%. Based on the results, the measurement area was specified to be within a maximum of 50% of the shear length in KS F 2082, from the viewpoint of conservatism.
Subsequently, the loading protocol was determined. Three load phases, including two preload steps, were proposed. A preload was applied to settle the test specimen into the test jig, and the test results from the acrylic sheet showed the necessity of preloading. A test on a plywood panel was conducted by applying this loading protocol, and the results demonstrated that the difference between the tensile and compressive deformations decreased as the stages progressed (36.1% in the first, 8.0% in the second, and 7.3% in the third load phase). Considering the large difference between the tensile and compressive directions in the first load phase, a loading protocol that introduces at least one preloading stage with 10% of the estimated maximum load was proposed in KS F 2082.
A CLT specimen was tested following the determined loading protocol and measurement area. The results indicated a 2.0% difference between the tensile and compressive slopes. This shows that the experimental method proposed in this study is suitable for achieving a pure shear state and effective for testing CLT.

