
1. INTRODUCTION
Carbon dioxide, a greenhouse gas, plays an important role in regulating the earth’s climate by absorbing and releasing the earth’s heat (Johnson et al., 2023; Sabine and Feely, 2015). However, increase in the quantity of CO2 in the atmosphere beyond the natural threshold limit causes global warming and unprecedented climate change, resulting in damage to the earth’s natural climate (Friedlingstein et al., 2022; Nunes, 2023; Pennisi, 2020; Raviraja, 2023; Yu and Chen, 2019). On the other hand, since quantitative and qualitative growth of trees depend directly on climate, understanding the relation between tree growth and CO2 is deemed relevant for forest management (Jeong et al., 2017; Ju et al., 2023; Kwon and Kim, 2005; Park et al., 2015; Seo et al., 2017a, 2017b).
Facilities such as open top change (OTC), whole tree chamber, free air CO2 enrichment system, temperature gradient chamber, and CO2-temperatrue gradient chamber were developed to study the changes in tree growth or physiological characteristics upon increase in the CO2 concentrations (Ceulemans and Mousseau, 1994; Hollister et al., 2023; Raison et al., 2007; Watanabe et al., 2016). Through these studies, it was found that the effects of increased CO2 concentration on tree growth were different depending upon the tree species, tree age, and growing conditions, such as soil, light intensity, humidity, and temperature (Fathurrahman, 2023; Kallarackal and Roby, 2012; Reed et al., 2018; Souza et al., 2019), and therefore, future studies should include these parameters to get a clearer picture (Ryu et al., 2014).
The National Institute of Forest Science, Suwon Korea, established the first OTC in 2009 to monitor the response of tree growth with increase in CO2 concentrations in the atmosphere over a long period (Lee et al., 2012). The OTC is a decagon having 10 m diameter, 7 m height, and an upper opening of more than 75% to minimize the differences between the inside of the OTC, the actual atmosphere, and the microenvironment (Dabros and Fyles, 2010; Zhang et al., 2005; Kimball et al., 2007). The OTCs were set in such a way so that they have different concentrations of CO2. The concentration of CO2 in one of the three OTCs (OTC-I) was 400 ppm, which is the same as that of the atmosphere. The other two were OTC-II which was 1.4 times (560 ppm) and OTC-III which was 1.8 times (720 ppm) higher than OTC-I (Kim et al., 2022). In all the OTCs, Pinus densiflora, Fraxinus rhynchophylla, Sorbus alnifolia, and Quercus acutissima are the major native tree species in Korea (National Institute of Forest Science, 2017). Three trees from each species were planted and all were of the same clone. Due to the OTC, the inside temperature was about 0.5°C–0.7°C warmer than the outside; however, there were no significant differences between the OTCs (Lee et al., 2012). The air humidity was not significantly different between the OTCs (4% or less), and between the OTCs and outside (0.1%–1%).
Past studies also reported the effects of CO2 enrichment on morphological and physiological activities of trees (Ryu et al., 2014), and phenological activity of the leaves of Q. acutissima (Seo et al., 2014). These studies indicated that different tree species have different morphological and physiological characteristics (e.g., stomatal morphology and photosynthetic capacity) depending upon CO2 enrichment and increasing carbon dioxide concentrations extends the growing season of Q. acutissima by accelerating leaf opening and retarding leaf fall.
To effectively manage wood resource, our understanding on the effects of increased CO2 concentration on tree growth is necessary (Lim et al., 2017). However, no studies have been conducted to date on quantitative radial growth, such as the widths of annual ring, earlywood and latewood, and the area of the annual ring. To address this gap, the current study aimed to investigate the effect of increasing CO2 concentration on the radial growth of Korean red pine. To this end, the widths of annual ring, earlywood and latewood, and the area of the annual rings were measured and compared with CO2 enriched scenarios considering the duration of the experiment.
2. MATERIALS and METHODS
Korean red pines (Pinus densiflora) from an OTC at the National Institute of Forest Science, Suwon (37° 15′ 04″ N, 136° 57′ 59″ E) were used for the present study (Table 1). Pines are the representative species among the most widely distributed single tree species in Korea. The pines in the OTCs were all from the same clone and four years old when planted in 2009. The disc-shaped samples obtained from the trees were about 5 cm thick and approximately 20 cm above the ground level from the external control (NOTC) and all OTCs (OTC-I, II, and III).
| Group | NOTC | OTC-I | OTC-II | OTC-III |
|---|---|---|---|---|
| Chamber installation | X | O | O | O |
| CO2 level | ≈ 400 ppm | ≈ 400 ppm | 560 ppm | 720 ppm |
| Number of trees | 3 | 3 | 3 | 3 |
| Tree species | Pinus densiflora Siebold & Zucc. | |||
All growth measurements were done through image analysis. To ensure accurate analysis, the collected disk samples were air-dried and surface-polished with #80 sandpaper through #120 and #360, which helped distinguish the cross-sectional tree-ring boundaries. The cross-sectional images were captured using a scanner (EPSON, 10000XL) at a resolution of 1,200 dpi. Subsequently, WinDENDRO (Regent Instrument, Québec, QC, Canada) was applied to measure the annual tree-ring width, earlywood width, and latewood width and Image J (v1.8.0, National Institutes of Health and the Laboratory for Optical and Computational Instrumentation) was applied to annual tree-ring area (Abràmoff et al., 2004; Guay et al., 1992; Schneider et al., 2012).
The growth comparisons of the CO2 levels were analyzed using the R statistical program (ver. 4.3.2.). For comparative analysis, all the measured data were tested for normal distribution and homogeneity of variance test, followed by analysis of variance (ANOVA). If statistically significant differences were identified between the OTCs after variance analysis, a post hoc analysis (Duncan test) was further performed. When normality was insufficient, a non-parametric test, viz. the Kruskal-Wallis H test was performed; whereas, when significant differences between the groups were identified, post-hoc analyses (Dunn's test) was done.
3. RESULTS and DISCUSSION
Tree-ring growth was compared between the pines from two groups, NOTC and OCT-I, and the CO2 level was the same as that of the atmosphere. Prior to the CO2 enrichment in 2008–2009, no significant difference (p < 0.05) in the annual tree-ring growth was found between the two groups. However, after CO2 enrichment began in 2010, a clear difference was observed in the increase in the annual tree-ring width, earlywood width, and tree-ring area (Fig. 1).
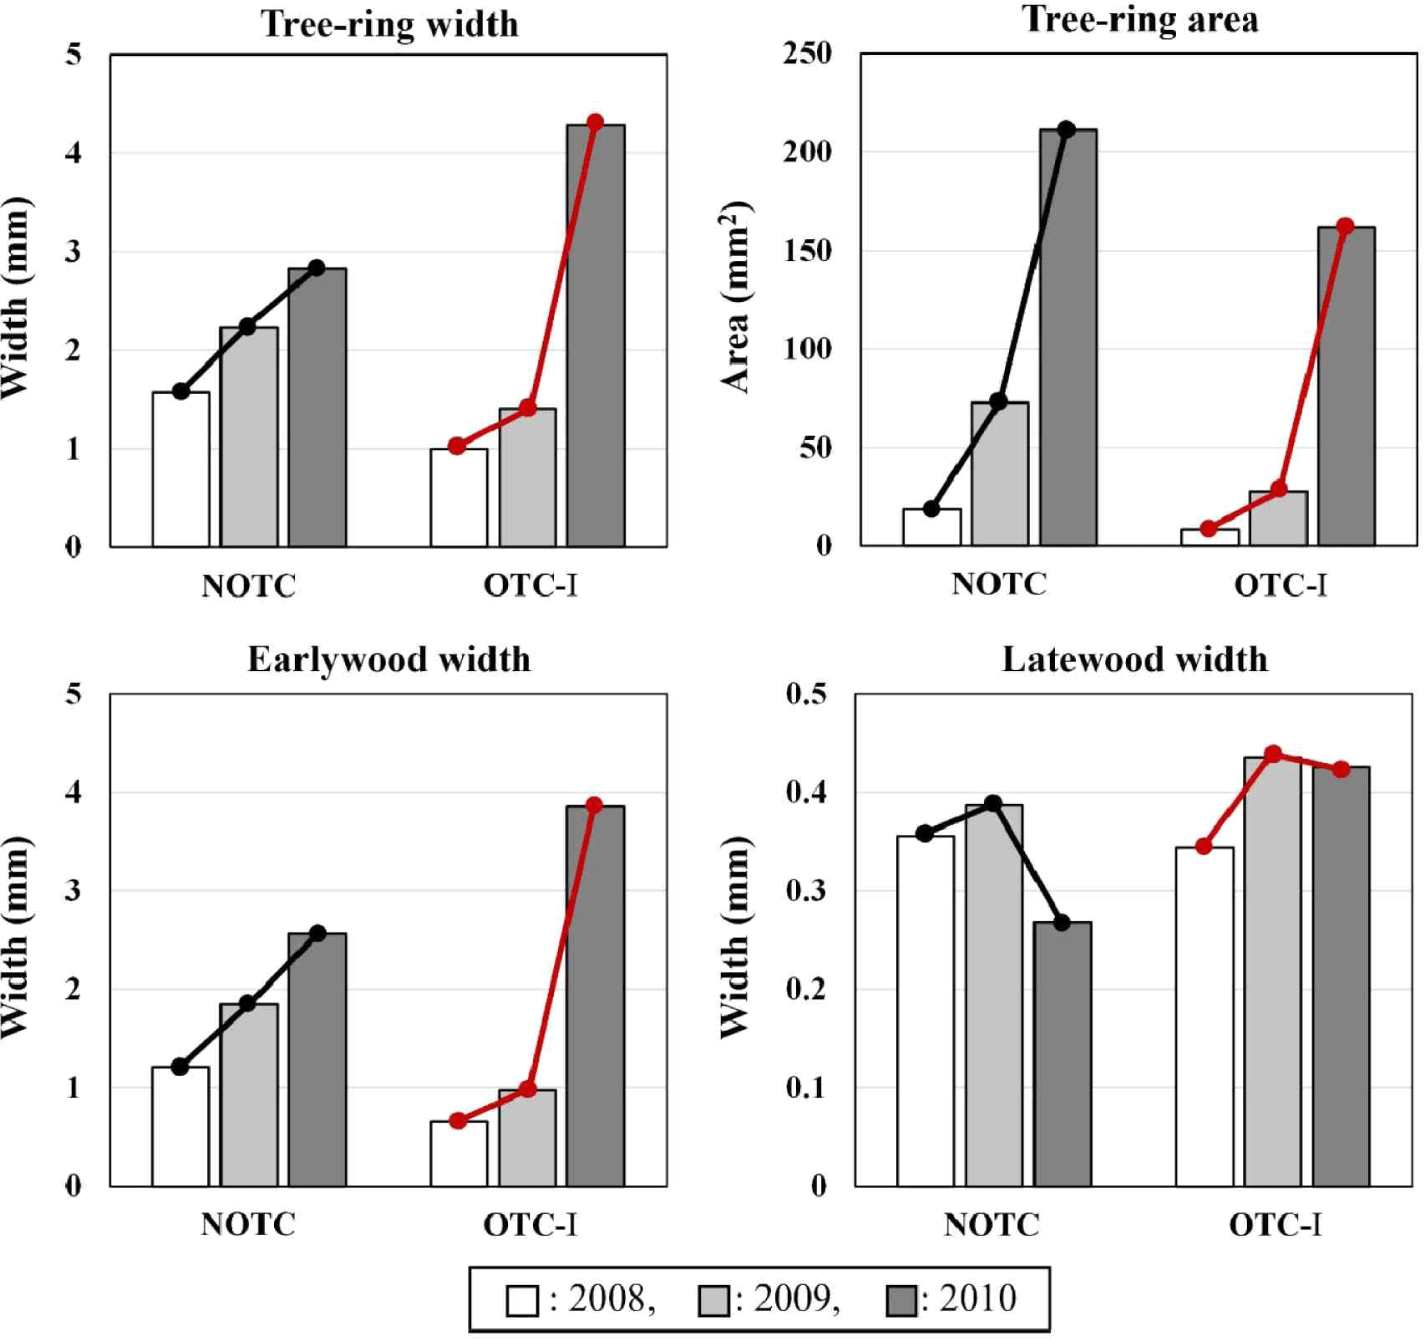
When compared with the years before CO2 enrichment, NOTC showed only 1.3 and 1.4 times increase in the width of the tree rings and earlywood, respectively, while OTC-I displayed an increase of about 3.0 and 4.0 times. Regarding the tree-ring area, NOTC increased by 2.9 times, whereas OTC-I increased by an average of 5.8 times. It was also observed that the width of the latewood decreased for NOTC, but OTC-I remained unchanged. Therefore, it was concluded that the latewood width was not significantly affected by the OTC installation.
According to a study using trees from the OTCs (Lee et al., 2012), the temperature between the NOTC and OTC-I was different around 0.5°C–0.7°C. Temperature can affect tree growth by impacting the initiation and termination of growth and the degree of cambial activity during the growth period, ultimately leading to an enhanced growth (Park et al., 2015, 2021; Yoo et al., 2021). This temperature condition can only be applied to OTC-I, II, and III. Therefore, subsequent analysis of growth with respect to CO2 levels was performed using OTC-I as reference value, along with OTC-II and III.
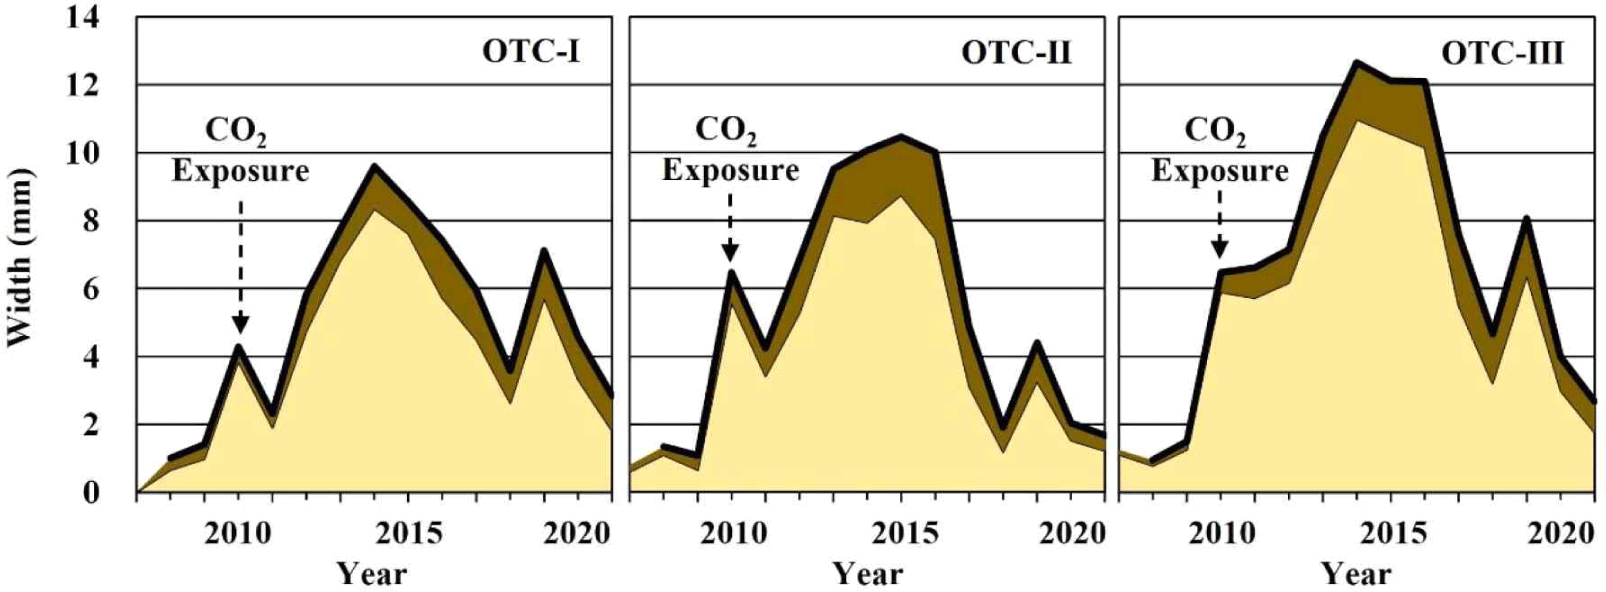
The annual tree-ring time series of each OTC and the accumulated graph shows a similar pattern (Fig. 2). The mean correlation coefficient between the tree-ring time series of the OTCs was 0.89 (p < 0.05; Table 2). The time series showed an increasing trend between 2014–2016, followed by a gradual decrease. In 2018, however, the ring widths of all the OTCs decreased suddenly.
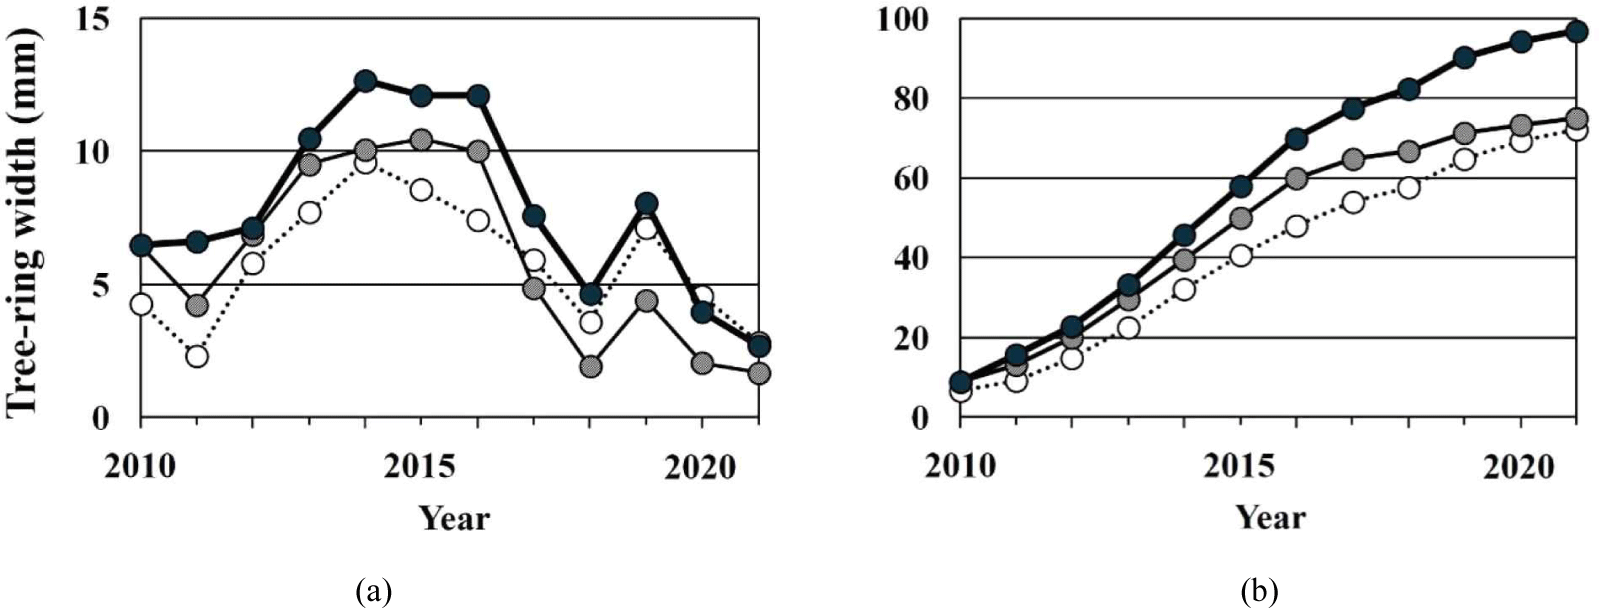
The mean tree-ring growth of OTC-III was the highest at 7.88 ± 3.72 mm, followed by OTC-II (6.04 ± 3.57 mm) and OTC-I (5.81 ± 2.82 mm; Table 2). Regarding the accumulated annual tree-ring growth until 2021, only OTC-III showed a considerable difference compared to OTC-I and -II. During the first 7 years after CO2 enrichment, OTC-II showed higher growth than OTC-I, after which the growth slowed lower. So, the tree-ring growth of OTC-II was slightly higher than OTC-I.
Although the amounts of CO2 enrichment were different depending on the OTCs, the annual tree-ring variations showed a similar pattern. This result is possibly due to an effect of climate. It is known that the same tree species growing under similar climatic conditions show a similar inter-annual growth pattern due to their high dependency on climate (Choi et al., 2020; Schweingruber, 1998; Seo et al., 2019, 2021). So, the sudden decrease of tree-ring growth in 2018 may be due to the effect of high summer temperature which was the warmest summer according to the meteorological data measured till 2021 in Korea (https://data.kma.go.kr/climate/).
The effects of CO2 on the tree-ring growth were different depending upon the CO2 concentration (Fig. 2). The trees grown under 720 ppm and 560 ppm of CO2 exhibited more growth than those under 400 ppm for 10 and 7 years, respectively. However, the tree-ring growth under 400 ppm was similar to the growth of that under 720 ppm and higher than the growth of the tree-ring under 560 ppm. This result indicates that tree growth is moderated by CO2 concentrations. To understand this, study of tree physiology is necessary.
The widths of the earlywood and latewood showed statistically significant differences between the OTCs (Table 3). Regarding the earlywood width, OTC-III displayed the largest width. The earlywood width of OTC-III (6.51 ± 3.32 mm) was significantly wider than that of OTC-I (4.75 ± 2.60 mm) and OTC-II (4.74 ± 3.06 mm; p < 0.01) although no significant difference was found between OTC-I and OTC-II. Concerning the latewood widths, OTC-III showed the highest width of 1.37 ± 0.76 mm, followed by OTC-II at 1.31 ± 0.81 mm and OTC-I at 1.06 ± 0.61 mm. A significant difference lied between OTC-III and OTC-I (p < 0.05).
The earlywood width was the primary determinant of growth in all the OTCs in this study (Fig. 3). The inter-annual tree-ring variation showed a higher correlation with the earlywood (0.98, p < 0.01) than with the latewood (0.61, p < 0.01). Furthermore, simple regression analysis showed that the earlywood width affected the tree-ring width growth significantly (p < 0.01). The adjusted R-squared value was 96%, indicating that wider the earlywood width, greater was the annual growth (B = 0.87).
The current research found that OTC-III, with the highest CO2 level, produced significantly wider early- and latewood, and the width of the earlywood was the primary factor responsible for that year’s growth. The surrounding growing environment influenced the formation process and anatomical characteristics of the wood cells (Cuny et al., 2019; Jasińska et al., 2015; Plomion et al., 2001; Schweingruber, 1991; Zhirnova et al., 2021). Various studies reported that the conifers are relatively sensitive to external growing environment (Cabral-Alemán et al., 2017; Peng et al., 2022), which is likely a reason for the distinct differences between the earlywood widths among the OTCs in this study.
The findings suggest that earlywood not only influences the growth but also the wood properties. The earlywood has thin cell walls and wide lumens, whereas the latewood has thicker cell walls and narrower lumens (Cuny et al., 2014; Kwon et al., 2020). This indicates that variations in growth due to increasing CO2 concentration can ultimately impact the wood properties, such as density, strength, and dimensional stability of the wood (Kwon et al., 2020; Lee et al., 2008).
The cross-sectional areas of the wood were 17,487.52 mm2 for OTC-I, 18,326.33 mm2 for OTC-II, and 30,925.62 mm2 for OTC-III, i.e. OTC-I was the smallest and OTC-III was the largest [Fig. 4(a)]. The largest annual increase in the cross-sectional area occurred in all three OTCs in 2010 when CO2 enrichment started [(Fig. 4(b)]. Prior to the CO2 enrichment, the average cross-sectional area increase was about two times, but in 2010, it was six times in OTC-I, thirteen times in OTC-II, and eleven times in OTC-III. Variance analysis indicated the differences in the means among the OTCs, while the t-test revealed a clear difference between OTC-I and OTC-III (p < 0.05).
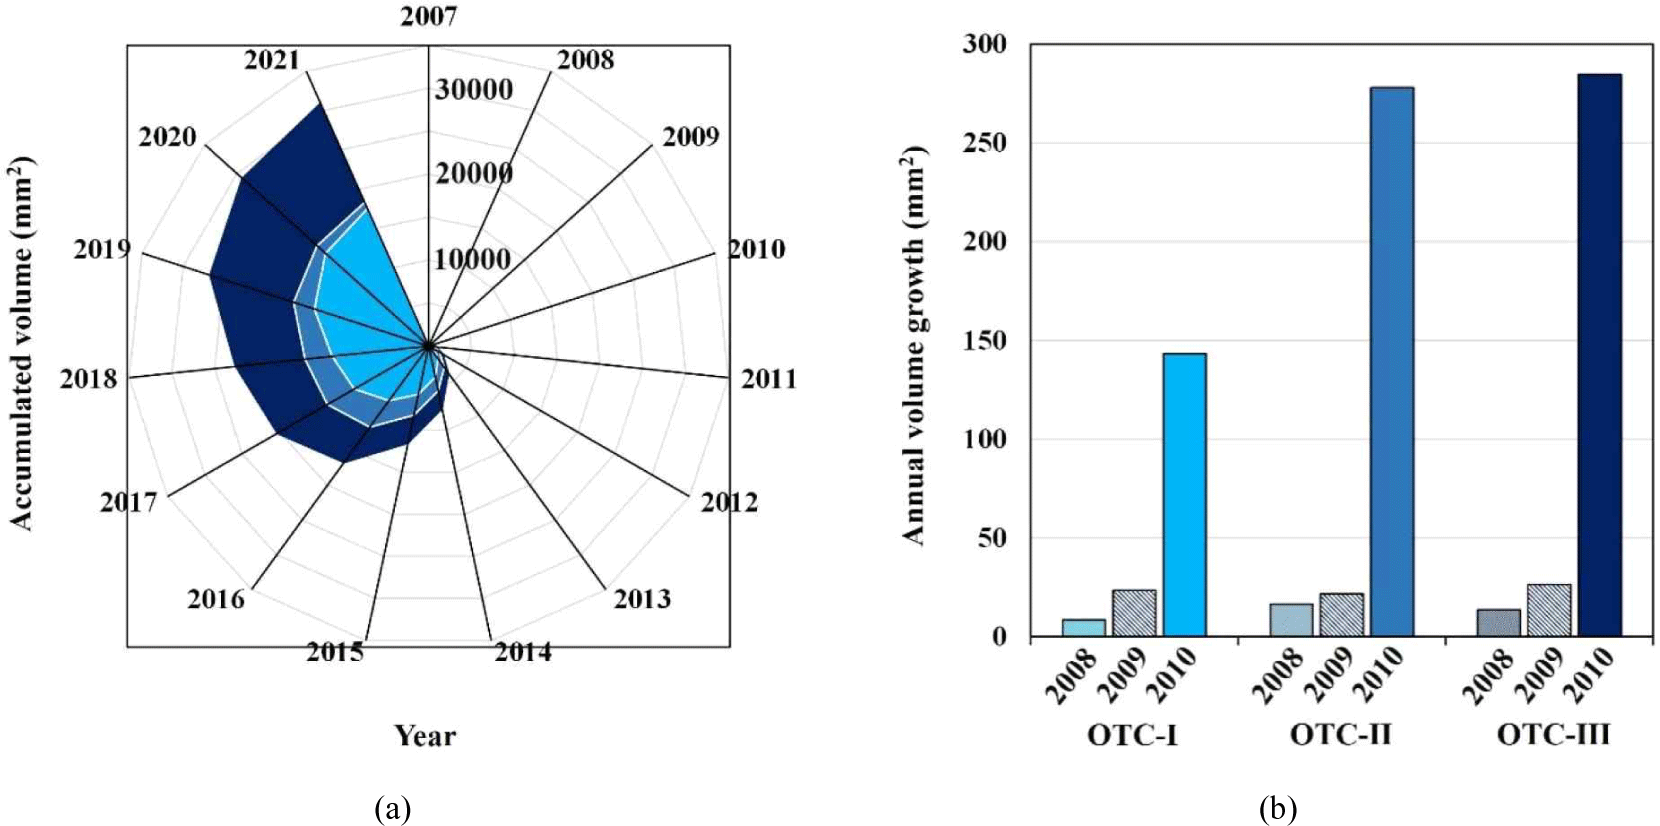
Most of the methods for calculating timber volume are based on the wood's cross-sectional area (Korea Forest Research Institute, 2023). This means that for the same length of timber, the volume will be proportional to the cross-sectional area of the wood. In the present study, it was estimated that OTC-III had the largest cross-sectional area, and therefore, had the largest volume. Volume is a common way to represent forest resources (Avery and Burkhart, 2002), and the knowledge of changes in volume with increasing atmospheric CO2 concentration is necessary for forest resource management.
4. CONCLUSIONS
The current study was fulfilled using the largest monitoring data from open-top chambers, which were designed to behave like a natural forest environment, in Korea. Therefore, the results serve as more reliable references than those from the greenhouse experiments which considered a short time span, say couple of years to apply to natural forests. Moreover, our results can serve as a fundament reference in making strategy to manage forests according to CO2 increment in the atmosphere.
Through the study, it was verified that CO2 increment can induce increase in the annual tree ring, earlywood and latewood widths, and annual tree-ring area of Korean red pine. Such positive effects will significantly support quantitative growth. However, from qualitative view point, it will be less important because growth mainly occurs in the earlywood, which has lower physical and mechanical properties than the latewood. In this regard, further study on the property of wood cells, such as cell-wall thickness, lumen size, or microfibril angle is required.