1. INTRODUCTION
There are many tasks to be performed to solve the lack of wood resources, including the renewal of tree species to economic species, increasing the added value of wood, and diversification of wood supply policies, but the effective use of thinned logs or waste wood that is generated in the forestry process has emerged as an urgent issue. To this end, research has been actively conducted on the development of wood composite boards with high productivity and new applications (Iswanto et al., 2020; Jamaludin et al., 2020; Prabuningrum et al., 2020; Setyayunita et al., 2022; Wibowo et al., 2021).
Sawdust, which was used as a material in this study, is produced in large quantities during the sawing process. Since long hot pressing time and a large amount of resin are required due to the nature of sawdust to produce boards with properties similar to those of conventional particle boards, only a small amount of sawdust was used for the smoothness and surface hardness of particle boards (Walker, 1993).
Lee and Yoon (1994) fabricated sawdust boards using the Methylene Diphenyl Diisocyanate (MDI) resin, and identified the effects of the specific gravity, mat moisture content, and resin content on the physical and mechanical properties of the boards. In addition, Oh (2002, 2003) fabricated sawdust boards with thinned logs from three species of conifers, and investigated properties according to the density, phenolic resin content, pressure, and hot pressing time.
Lee and Han (1998) fabricated boards by mixing pretreated rice hulls and wood particles, and investigated the appropriate mixing ratio by measuring physical properties. They reported that excellent bending strength and peel strength were obtained when 25% of blasted rice hulls and 75% of wood particles were mixed. In addition, Seo (1987) fabricated sawdust boards by mixing polypropylene fibers, which are known to have excellent moisture and water resistance as well as high tensile strength, as materials other than wood because the properties of sawdust are not enough to produce excellent boards. Thickness expansion, bending properties, peel resistance, and screw retention were investigated to identify the possibility of developing boards by mixing sawdust and plastic chips. Hwang and Oh (2020a, 2020b) measured the physical properties and mechanical performance of the boards fabricated using sawdust, rice husk, and charcoal.
Meanwhile, mandarin peels, which were used in this study, are byproducts that are mainly generated from the processing of mandarin oranges produced in Jeju Island, South Korea. In Jeju Island, 77,602 tons of mandarin oranges were processed in 2020 (JCMSA, 2020), and approximately 50% of them were disposed of as byproducts after squeezing the juice. A significant portion of them was dumped into the ocean due to the lack of storage and treatment facilities, resulting in serious marine pollution and cost increase (Bu, 2015). A complete ban on the discharge of land waste into the ocean from January 1st, 2016 also makes it difficult to treat mandarin peels. As such, various facilities have been constructed in Jeju Island to utilize mandarin peels as livestock feed, and various efforts have been made, including the mandarin peel feed support project.
If new products are developed using mandarin peels to effectively block marine environmental pollutants and increase the income of farm households, they will be significantly helpful in recycling mandarin peels that are difficult to handle.
Wood ceramics are new porous carbon materials made of wood and thermosetting resin. Since their development, various studies have been conducted because they have different physical properties depending on the raw material type and manufacturing conditions (Hirose et al., 2002; Iizuka et al., 1999; Oh, 2014, 2016; Oh and Byeon, 2006). As for wood, which is the main raw material, waste wood can be used in addition to general wood. Recently, studies have been conducted on producing ceramics using non-wood resources that are discharged as various byproducts and waste in a situation where wood resources are insufficient, including the development of new materials using rice husk and wood and the development of materials using giant silvergrass (Hwang and Oh, 2021, 2022; Hwang et al., 2021).
Therefore, in this study, composite boards were fabricated using sawdust and mandarin peels, which are classified as general waste and difficult to handle. Ceramics were then produced through carbonization, and mechanical properties and density profile were measured to provide basic data for developing new applications for carbon materials that use sawdust and mandarin peels.
2. MATERIALS and METHODS
The sawdust generated during the sawing of larch (Larix kaemferi C.) was used in the experiment, and the mandarin peels purchased from Jeju Island were dried under shade and pulverized using a grinder (Hwang and Oh, 2022). Each material was sifted through 18 mesh for a uniform particle size in samples, and the moisture content was controlled at 6% or less (Hwang and Oh, 2022).
Powder phenolic resin (KNB-100PL, Kolon Industries, Seoul, Korea) was used to fabricate sawdust/mandarin peel boards that are used to produce ceramics, and liquid phenolic resin (KPD-L777, Kolon Industries) was used for impregnation to produce ceramics (Hwang and Oh, 2022). Table 1 shows the characteristics of each resin type (Hwang and Oh, 2022).
260 mm × 260 mm × 14 mm boards were fabricated by sufficiently mixing sawdust, mandarin peels, and resin, and then placing the mixture in a stainless steel mold and applying hot-press molding (Hwang and Oh, 2019). As for board fabrication conditions, ten boards were fabricated for each mandarin peels addition rate (5%, 10%, 15%, 20%, and 25%) when the density was 0.6 g/cm3 (Hwang and Oh, 2019). For a mandarin peels addition rate of 10%, 40 boards were additionally fabricated for ceramic fabrication conditions. After setting the hot pressing temperature to 190°C, the pressure to 40, 30, and 20 kgf/cm2, and the pressing time to 6, 5, and 4 minutes, three-step pressurization was performed. A thickness bar was used to fix the board thickness, and a Teflon plate was used to prevent adhesion between the board fabricated using heat and the hot plate (Hwang and Oh, 2019).
The fabricated boards were cut into a size of 120 mm × 120 mm × 14 mm and the density was calculated. Specimens with a target density ± 0.03 g/cm3 were selected for each condition (Hwang and Oh, 2019).
The specimens were placed in an impregnation tank containing resin, and the resin impregnation rate was adjusted by controlling the repetition time and the number of repetitions using the method of performing both decompression (1 atm) and ultrasonic treatment (frequency: 28 kHa and output: 564 W) and then leaving the specimens under normal pressure again (Hwang and Oh, 2019). After impregnation, the specimens were dried under shade for eight hours and then continuously dried and hardened in a drier at 60°C for eight hours and at 130°C for eight hours before calculating the resin impregnation rate using Equation (1) (Hwang and Oh, 2019). Fig. 1 shows the schematic of the impregnation equipment used.
where, W1: Dry weight of the board after resin impregnation (g), Wn: Dry weight of the board before resin impregnation (g).
Table 2 shows manufacturing conditions of ceramics. The temperature was increased from room temperature to the set temperature at a rate of 4°C/min for the carbonization of the impregnated board. After two hours at the set temperature, cooling water was circulated for cooling (Hwang and Oh, 2019).
The ceramics fabricated under each condition were subjected to humidification at a temperature of 20 ± 2°C and a humidity of 65 ± 5%, and then the bending and compression strengths were investigated. The strengths were measured under a loading rate of 5 mm/min. using a universal testing machine (Autograph AGS-10 kN, Shimadzu, Kyoto, Japan).
3. RESULTS and DISCUSSION
Figs. 2 to 4 show the bending strength of ceramics.

The bending strength of the fabricated ceramics according to the resin impregnation rate is shown in Fig. 2. The bending strength was 7.25 MPa at an impregnation rate of 40 ± 3%, 7.44 MPa at 50 ± 3%, 8.41 MPa at 60 ± 3%, and 8.58 MPa at 70 ± 3%, showing that the bending strength increased as the resin impregnation rate increased. This appears to be because the phenolic resin that penetrated into the cell lumen strengthened the cell wall and affected strength while it was converted into glassy carbon during the carbonization process (Okabe and Saito, 1995). This result showed a tendency similar to that of the bending strength measurement results for the ceramics made of sawdust and rice husk by Piao (2004).
Fig. 3 shows the bending strength of the fabricated ceramics according to the carbonization temperature. The bending strength was 5.07 MPa at an impregnation temperature of 600°C, 7.44 MPa at 800°C, and 7.90 MPa at 1,000°C, and 11.09 MPa at 1,200°C, indicating that the bending strength increased as the carbonization temperature increased. Hwang and Oh (2017) reported that the length and thickness reduction rates of the ceramics made of boards mixed with sawdust and mandarin peels increased as the temperature increased to 1,000°C and then slowly increased, and that the volume of the material showed a tendency to decrease as the carbonization temperature increased. In general, the strength of a material shows a tendency to increase as its volume decreases and its density increases, and it appears that an increase in carbonization temperature also affected the bending strength because the density was increased.
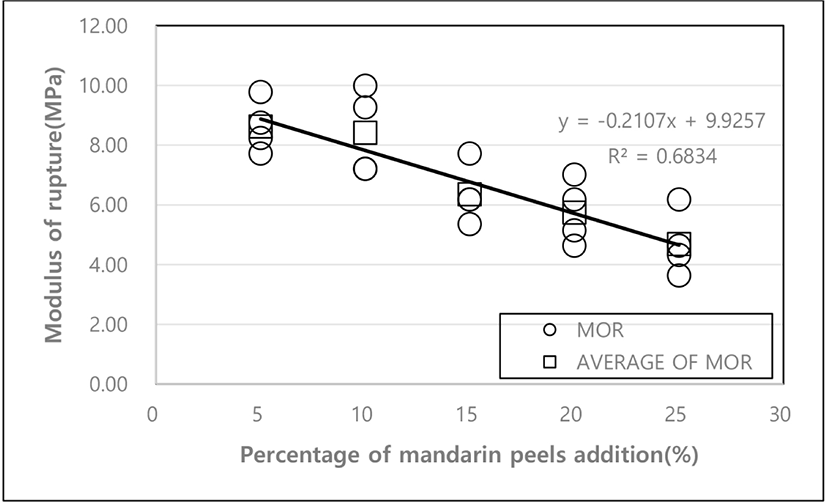
Fig. 4 shows the bending strength of the ceramics according to the mandarin peels addition rate. The bending strength was 8.62 MPa at a mandarin peels addition rate of 5%, 6.35 MPa at 15%, and 4.69 MPa at 25%, showing that the bending strength decreased as the addition rate increased. This appears to be because the bond strength between sawdust and mandarin peels decreased as the mandarin peels addition rate increased.
Figs. 5 to 7 show the compression strength of ceramics.


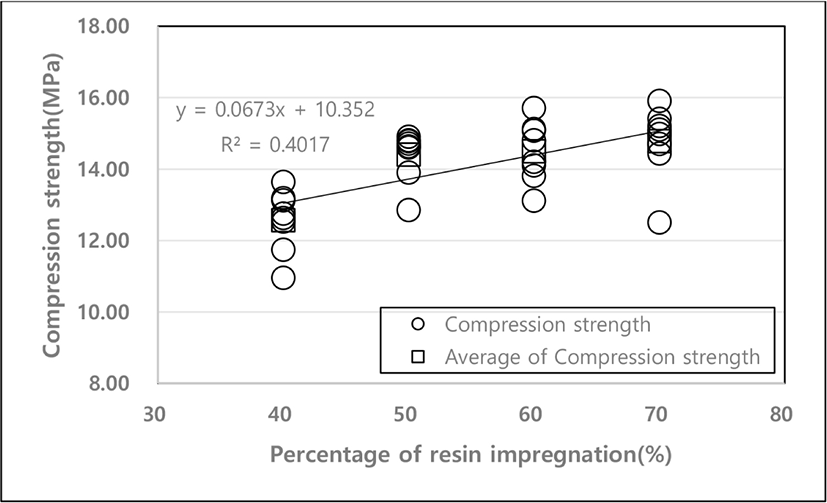
The compression strength of the fabricated ceramics according to the resin impregnation rate at a carbonization temperature of 800°C is shown in Fig. 5. When the resin impregnation rates were 40 ± 3, 50 ± 3, 60 ± 3, and 70 ± 3%, the compression strength was measured to be 12.56, 14.40, 14.48, and 14.77 MPa, respectively, showing that the compression strength also increased as the impregnation rate increased. Fig. 6 shows the compression strength of the ceramics according to the carbonization temperature. The compression strength was 11.03 MPa at a carbonization temperature of 600°C, 14.4 MPa at 800°C, 16.71 MPa at 1,000°C, and 17.20 MPa at 1,200°C, confirming that the compression strength increased as the carbonization temperature increased. This is in agreement with the results of Byeon et al. (2010) that the compression strength of the wood ceramics made of paper mulberry showed a tendency to increase as the carbonization temperature increased. In addition, Oh (2004) reported that the compression strength of the wood ceramics made of the thinned logs of pine, Korean pine, and larch also increased as the carbonization temperature increased.
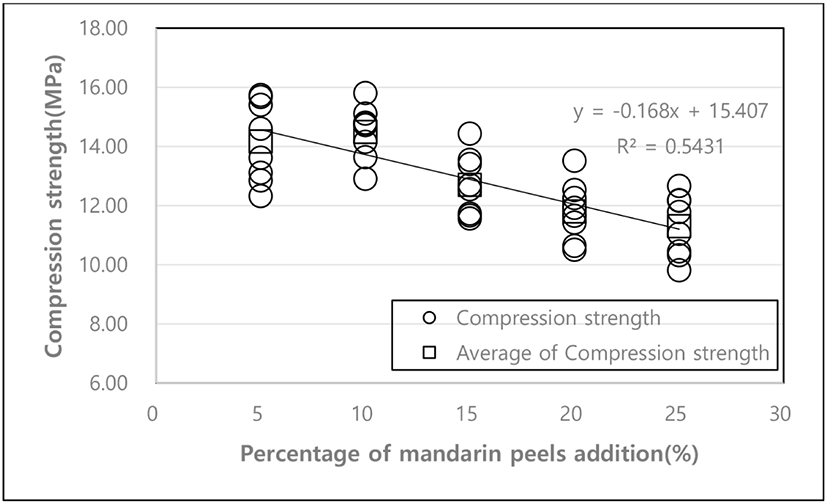
Fig. 7 shows the compression strength of the ceramics according to the mandarin peels addition rate. The compression strength was 14.16 MPa at an addition rate of 5%, 12.69 MPa at 15%, and 11.30 MPa at 25%, showing that the strength decreased as the addition rate increased. This appears to be because the bond strength between sawdust and mandarin peels decreased as the mandarin peels addition rate increased.
Tables 3 to 5 show the density profile, which is the ratio of the minimum density to the average density in the thickness direction of the ceramics, according to the resin impregnation rate, carbonization temperature, and mandarin peels addition rate.
| Rate of resin impregnation (%) | Dave (kg/m3) | Dmin (kg/m3) | Dmax (kg/m3) | Dmin/Dave (%) |
|---|---|---|---|---|
| 40 | 645 | 511 | 916 | 79.4 |
| 50 | 819 | 679 | 1,047 | 83.0 |
| 60 | 755 | 639 | 1,006 | 84.7 |
| 70 | 838 | 738 | 1,010 | 88.1 |
| Carbonization temperature (°C) | Dave (kg/m3) | Dmin (kg/m3) | Dmax (kg/m3) | Dmin/Dave (%) |
|---|---|---|---|---|
| 600 | 696 | 581 | 943 | 83.6 |
| 800 | 819 | 679 | 1,047 | 83.0 |
| 1,000 | 858 | 724 | 1,137 | 84.4 |
| 1,200 | 795 | 702 | 1,065 | 88.2 |
| Rate of mandarin peels addition (%) | Dave (kg/m3) | Dmin (kg/m3) | Dmax (kg/m3) | Dmin/Dave (%) |
|---|---|---|---|---|
| 5 | 858 | 770 | 1,106 | 89.7 |
| 10 | 755 | 639 | 1,006 | 84.7 |
| 15 | 794 | 661 | 1,067 | 83.2 |
| 20 | 821 | 657 | 1,081 | 80.0 |
| 25 | 754 | 622 | 964 | 82.5 |
The density profile according to the impregnation rate is shown in Table 3. The density profile was 79.4% at an impregnation rate of 40 ± 3%, 83.0% at 50 ± 3%, 84.7% at 60 ± 3%, and 88.1% at 70 ± 3%, indicating that the density distribution from the surface layer to the center layer was more uniform as the impregnation rate increased. Table 4 shows the density profile according to the carbonization temperature. The density profile was 83.6% at a carbonization temperature of 600°C, 83.0% at 800°C, 84.4% at 1,000°C, and 88.2% at 1,200°C, indicating that the density distribution from the surface layer to the center layer was more uniform as the carbonization temperature increased.
Table 5 shows the density profile according to the mandarin peels addition rate. The density profile was 89.7% at an addition rate of 5%, 83.2% at 15%, and 82.5% at 25%, indicating that the density distribution from the surface layer to the center layer was more uniform as the addition rate decreased.
4. CONCLUSIONS
In this study, ceramics were fabricated using sawdust and mandarin peels, and the bending strength, compression strength, and density profile were measured according to the mandarin peels addition rate, resin impregnation rate, and carbonization temperature.
-
When the impregnation rate was 70 ± 3%, the bending strength and compression strength showed the highest values of 8.58 and 14.77 MPa, respectively.
-
When the carbonization temperature was 1,200°C, the bending strength and compression strength exhibited the highest values of 11.09 and 17.20 MPa, respectively.
-
The bending strength was 8.62 MPa and the compression strength was 14.16 MPa when the mandarin peels addition rate was 5%, and the strengths increased as the addition rate decreased.
-
The density distribution from the surface layer to the center layer was more uniform as the resin impregnation rate and carbonization temperature increased, and the density profile decreased as the mandarin peels addition rate decreased.


