1. INTRODUCTION
Eucalyptus trees have a major socio-economic role in Morocco, due to their plasticity and rapid growth capacity (Famiri et al., 2001). Indeed, Eucalyptus wood is used in the industry as pulp, logs, firewood and charcoal. However, the uses of eucalyptus as a timber remain limited because the appearance of cracks and/or splits due to the growth stresses releasing during cutting, sawing and drying. In addition, the eucalyptus exhibit high shrinkage and collapses (Maziri et al., 2010; Wessels et al., 2016; Amer et al., 2017).
Beneficial use of eucalyptus such Eucalyptus globulus wood needs searching methods to reduce these defects. This requires a study of water transfer in this kind of wood and control the drying rate. Diffusivity of water is an important phenomenon in wood drying studies (Peralta and Bangi, 2003; Kouchade, 2004; Ghazil, 2010).
Wood is a hygroscopic material. In storage, it is exposed to both absorption and desorption processes of moisture from the surrounding air (Baronas et al., 2001; Okoh, 2014). Moisture content significantly influences wood physical and mechanical properties, which are of great importance for wood uses in different applications areas (Shi, 2007; Noorolahi et al., 2008; Sonderegger et al., 2011; Franke et al., 2016; Lee and Lee, 2018; Pang and Jeong, 2019).
Water transfer in wood is a very complex process. It diffuses in three different forms: free water in wood above fiber saturation point (FSP), bound water and water vapor in the wood below FSP point (Vasic et al., 2012; Engelund et al., 2013; Okoh, 2014; Bennani et al., 2017). Water diffusion in wood depends on numerous factors, such as wood moisture content, diffusion direction, time, temperature, relative humidity and type of wood (Jannot et al., 2006; Tamme et al., 2011; Sandoval-Torres et al., 2014; Kim et al., 2017).
Drying eucalyptus wood can be done naturally or industrially, but conventional kiln drying is the most common practice among the artificial drying methods used in the wood industry (Travan et al., 2010; Chang et al., 2017; Kang and Kang, 2018). The conventional kilns typically operate in temperatures ranging from 40 to 80 °C (Batista et al., 2013).
In this work, we studied the water diffusion in E. globulus wood in radial and tangential directions at a fixed temperature and relative humidity values by analyzing absorption and desorption kinetics of water and estimating the diffusion coefficients. We also investigated convective drying tests in order to reduce defects and get a good quality of drying for the considered wood.
2. MATERIALS and METHODS
The vegetal material used in this study consists of three trees of E. globulus Labill. from the Khmiss Sahel forest in Larache region (North of Morocco). The selected trees are more than 30-years-old. The corresponding circumferences are ranged between 100 and 118 cm. These trees have a good straightness and are free of defects. In Table 1, we reported dendrometric characteristics measurements of sampled trees.
| Tree | ht (m) | C1.3 (m) | Cbase (m) | MC (%) |
|---|---|---|---|---|
| 1 | 15 | 1.18 | 1.90 | 91 |
| 2 | 14 | 1.03 | 1.82 | 89 |
| 3 | 13 | 1.00 | 1.80 | 89 |
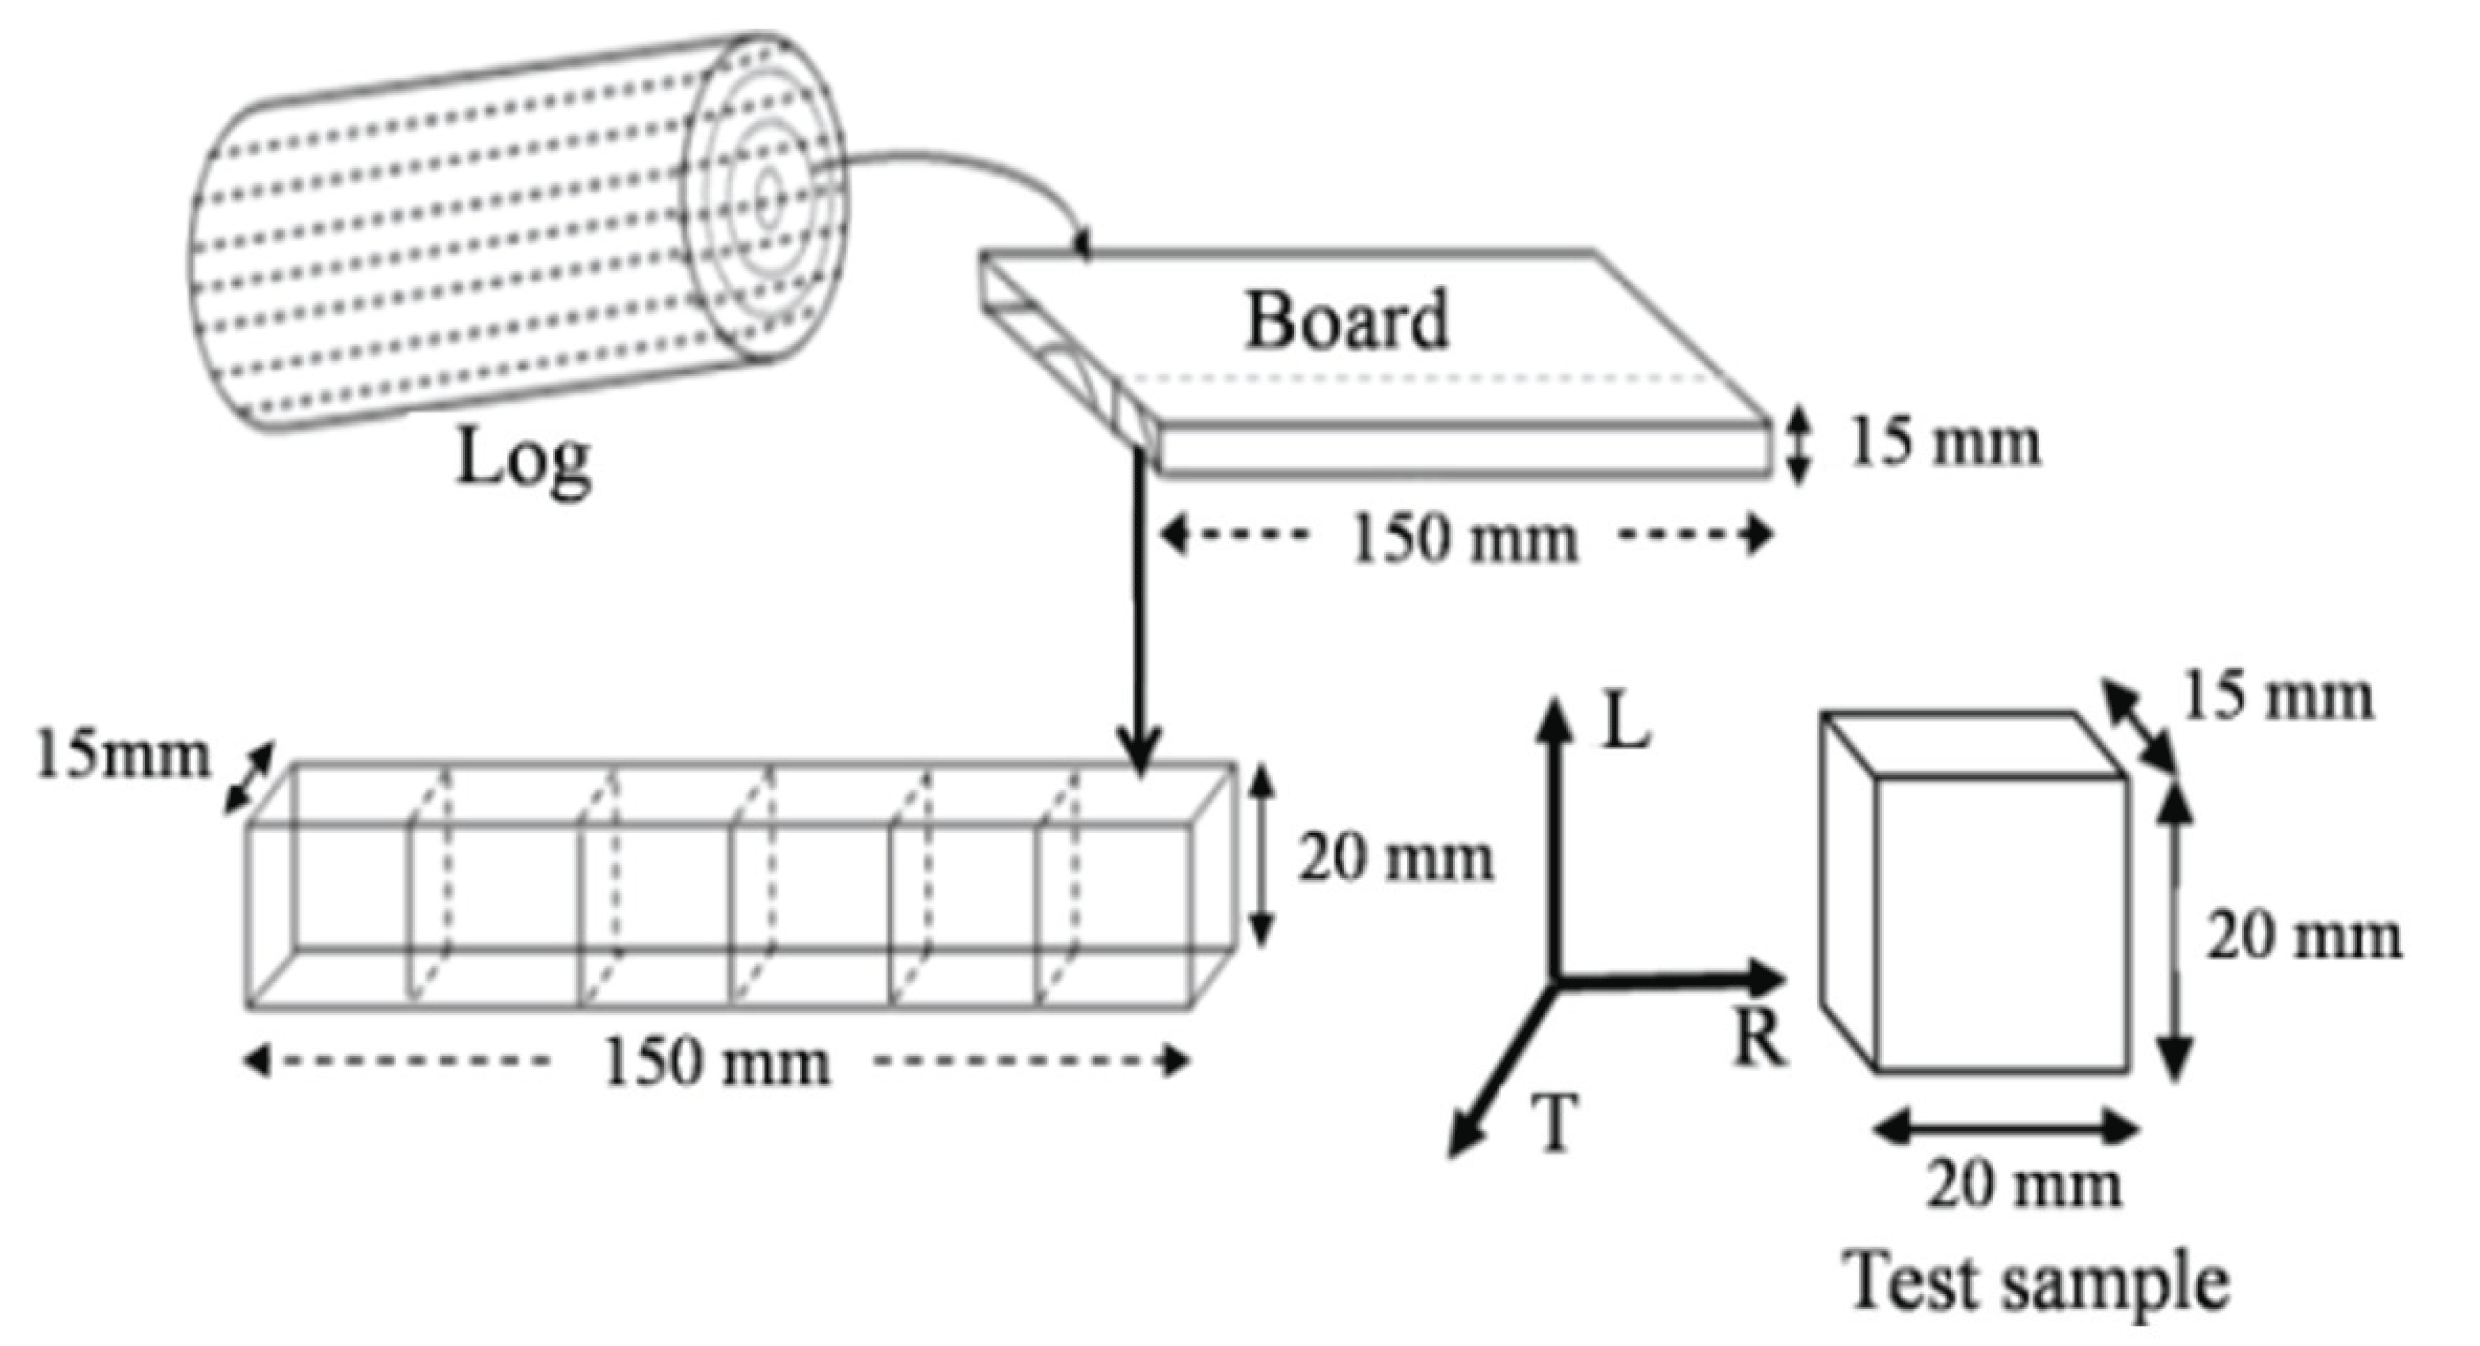
The wood samples used in this study were taken from the heartwood along the same longitudinal bars and the first log of each tree. The selected samples have a parallelepipedic form with dimensions (20 × 20 × 15) mm3 (Fig. 1). We have prepared 40 specimens for studying absorption kinetics in the radial direction (20 samples) and tangential direction (20 samples). The same number (40 specimens) is used in the desorption study. The samples were covered with aluminum tape on the four sides. The water diffusion in radial or tangential directions is studied along the two other open sides.

Water diffusion in E. globulus wood was carried out by using a water basin for absorption study and a climatically chamber for desorption measurement (Fig. 2). The climatic conditions (temperature T and relative humidity Hr) surrounding the samples were controlled during desorption experiments.
To follow water absorption kinetics in the wood, the samples which have initially moisture content about 10% were submerged in the water basin at ambient temperature (25°C). The changes in the samples weight are recorded at regular intervals time (each 2 min) until saturation in 24 hours.
In the study of desorption kinetic, the moisture content in the wood samples was almost 60% initially. The samples were placed in climatically chamber at temperature 30 °C and relative humidity 60%, their weights were measured at regular time intervals during 24 hours until equilibrium state.
The relative humidity and samples weights were measured respectively by a digital hygrometer of accuracy (0.01 %) and an electronic balance with precision (0.001 g) controlled with a computer.
The wood samples were placed in an oven at 103 °C during 48 hours to obtain the dry mass and to determine the moisture content.
The wood moisture content denoted (MC) is equal to the quantity of water contained in the wood, expressed as a percentage of dry weight:
where Wh: wet wood mass (g), and Wo: dry wood mass (g).
Driving force of transfer is moisture gradient. The following approach treats the internal transfer mechanism of moisture diffusion in wood. According to Fick's second law, the diffusion equation is given by (Houngan et al., 2015):
where C = C(x, t): wood moisture concentration (g cm-3) at the x thickness (cm) in time t (s), and D: the diffusion coefficient (m2s-1). By defining a dimensionless water content C+:
where Ceq and MCeq: average samples moisture concentration (g cm-3) and moisture content (%) at equilibrium according to the hygro-thermal imposed conditions, Cin and MCin: average initial moisture concentration (g cm-3) and moisture content (%) in the samples, C and MC: average moisture concentration (g cm-3) and moisture content (%) in wood samples at the time t (s).
Assuming that D is constant, equation (2) becomes:
Analytic solution for equation 4 is given by the following relation (Kouchade, 2004):
Referred to gain or loss of the dimensionless mass by:
Where Δm and Δmmax represent the variation of the sample mass (g) at time t (s) and at equilibrium; W(t): weight at any time (g); Win: initial weight (g), and Weq: weight at equilibrium (g).
The experimentally measured magnitude m*(t) and the calculated analytically C+(t) being dimensionless. Thus, C+(t) can be written C+(t) ≡ m*(t). The slope linear part in curve (Fig. 3) represent the variation of m*(t) depending √t . We can determine D by using the expression (5).
Value of diffusion coefficient D is calculated by the direct method of half-rise time t0,5 which is corresponding to m*(t) = 0.5. In this time, the diffusion coefficient D is expressed by the following equation (Kouchade, 2004):
where e: sample thickness (cm).
End splits of wood boards are determined by a parameter called splitting indicator Ie, which is given by the following relation (Hakam et al., 2005):
where L: boards length (cm); n: split number; fn: depth of nth split (cm); fmax: depth of maximal split (cm); Iebefore: splitting indicator before drying; Ieafter: splitting indicator after drying, and k: average or maximum.
Drying tests are realized in a traditional wood dryer type Cathild installed at the Forest Research Center (FRC) in Rabat. The heating in the dryer was performed by electrical resistances. The drying conditions were controlled automatically by connection to a computer with specific software, which permits visualization and control in real-time drying parameters evolution, such as relative humidity, temperature, air velocity and equilibrium moisture. The full automatic control system is used for the experiments. The dryer is filled with boards stacked as horizontal rows and separated by stickers with a section of 2 × 2 cm2, six stickers per row (Hakam et al., 2005). Drying tests were carried out on boards with length 2.50 m, width from 25 to 30 cm (according to the diameter of the log) and thickness of 3 cm.
Drying conditions are based on drying techniques of hardwood and softwood species which were subject to several studies conducted by TCWFI (Technical Center for Wood and Furnishing Industries) and other authors for the eucalyptus wood species (Kantay et al., 2002, Hakam et al., 2003), which have obtained wood products with a good quality and lower deformation.
Many experiments were done on drying E. globulus wood to achieve optimum drying conditions, minimize damage and distortions (collapse, splits, cracks, etc.) and improve the wood quality. The best results of these experiments are shown in Tables 2 and 3. In the first test of drying conditions, the temperature varied from 46 to 60 °C, while in the second test temperature varied between 40 and 70 °C.
where V: ventilation velocity (%) of the maximum value, Vt : ventilation time (hour); 50% right & 50% left, T: temperature (°C), t: time of sequence (hour), RH: relative humidity (%), EMC: equilibrium moisture content (%), FSP: fiber saturation point, MC: wood moisture content (%). T gradient: upwards or downwards slope of the temperature (°C/hour).
3. RESULTS and DISCUSSION
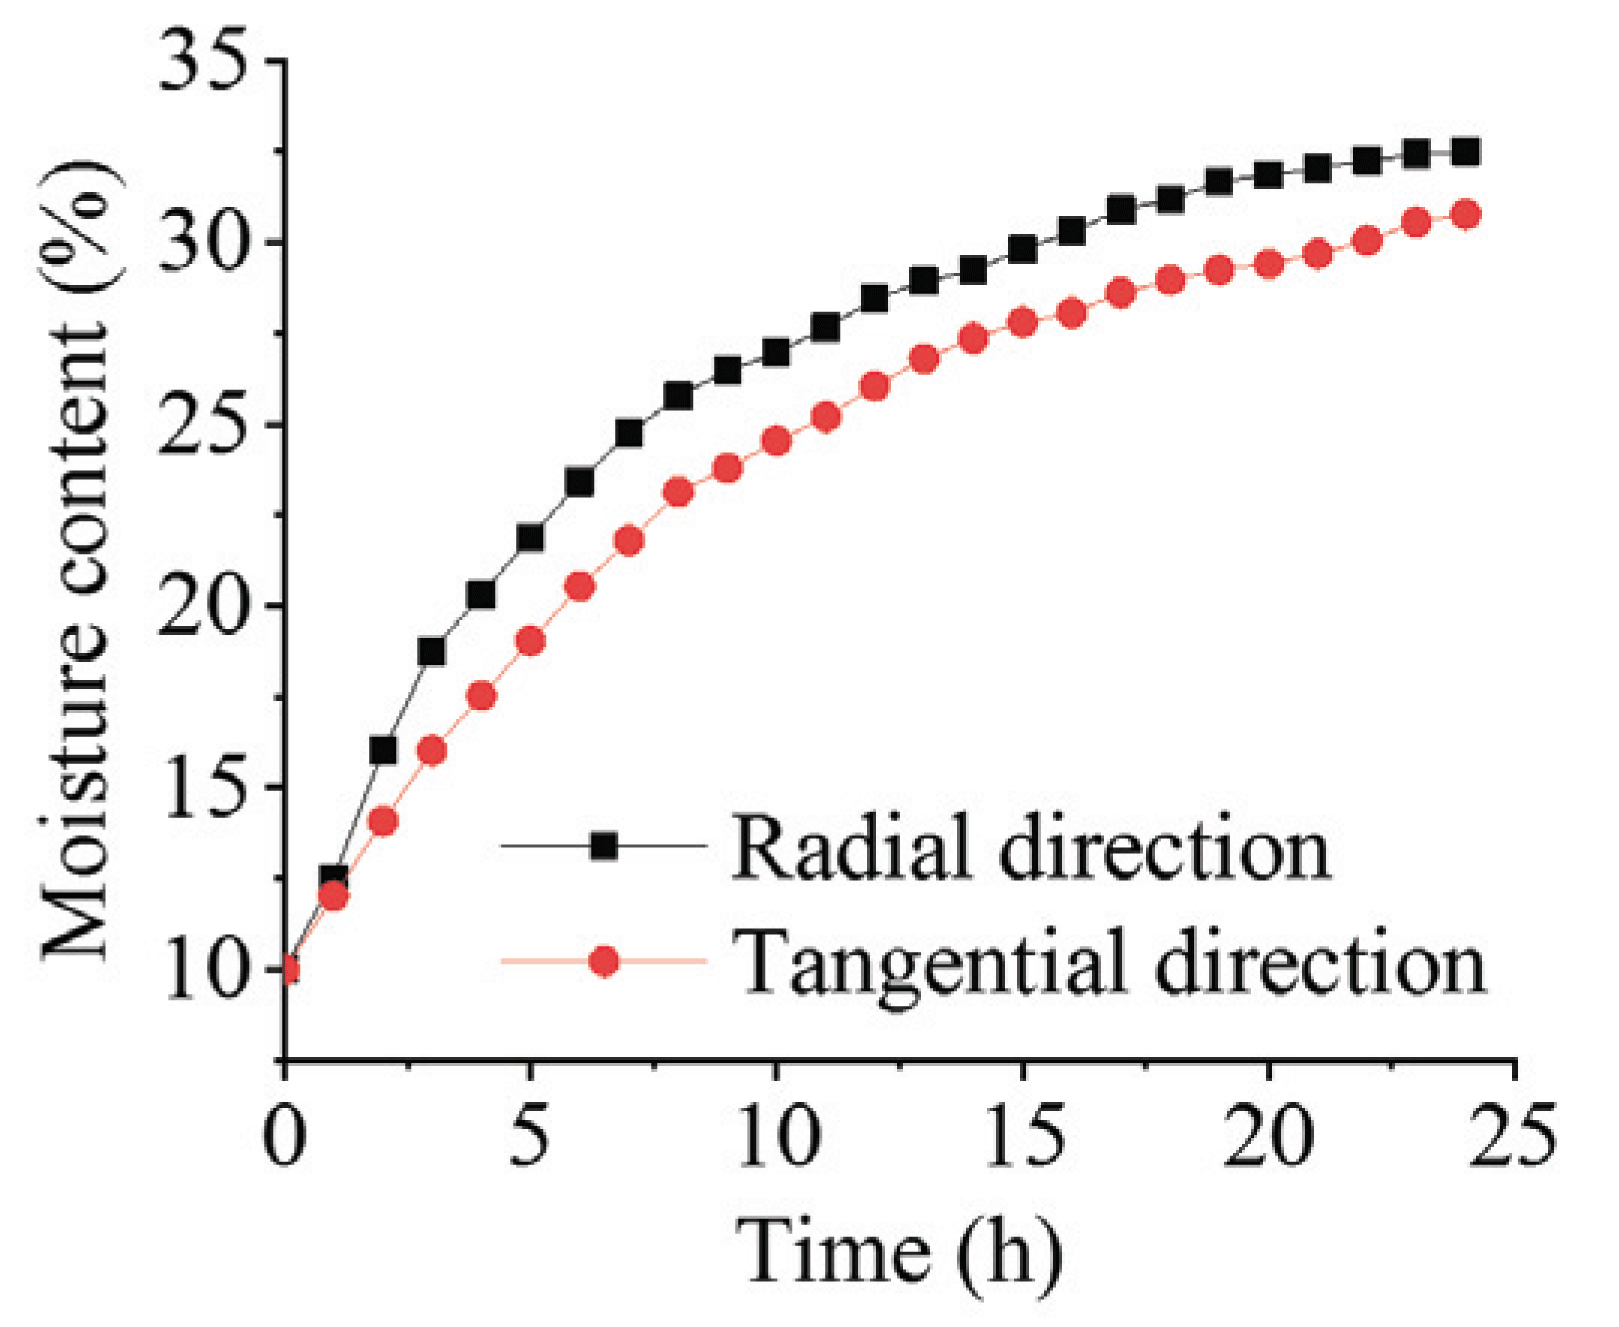
General profiles of water sorption kinetics in radial and tangential directions for wood samples are almost similar (Fig. 4). The obtained results of absorption kinetics in the radial and tangential directions show that the moisture of wood samples in the radial direction increased from 10 to 32.5 % during 24 hours. While in the tangential direction it increased from 10 to 30.8 % in the same period. By comparing the curves of absorption kinetics in the two directions, we can deduce that the E. globulus wood is slightly more diffusive in the radial direction. In this direction, the vascular rays are the main source of the water diffusion; especially their structure, arrangement and positioning, which promote the phenomenon of diffusivity (Kouchade, 2004). In the tangential direction, the early-wood and late-wood layers are arranged in parallel, which promotes more the diffusion in the radial direction.

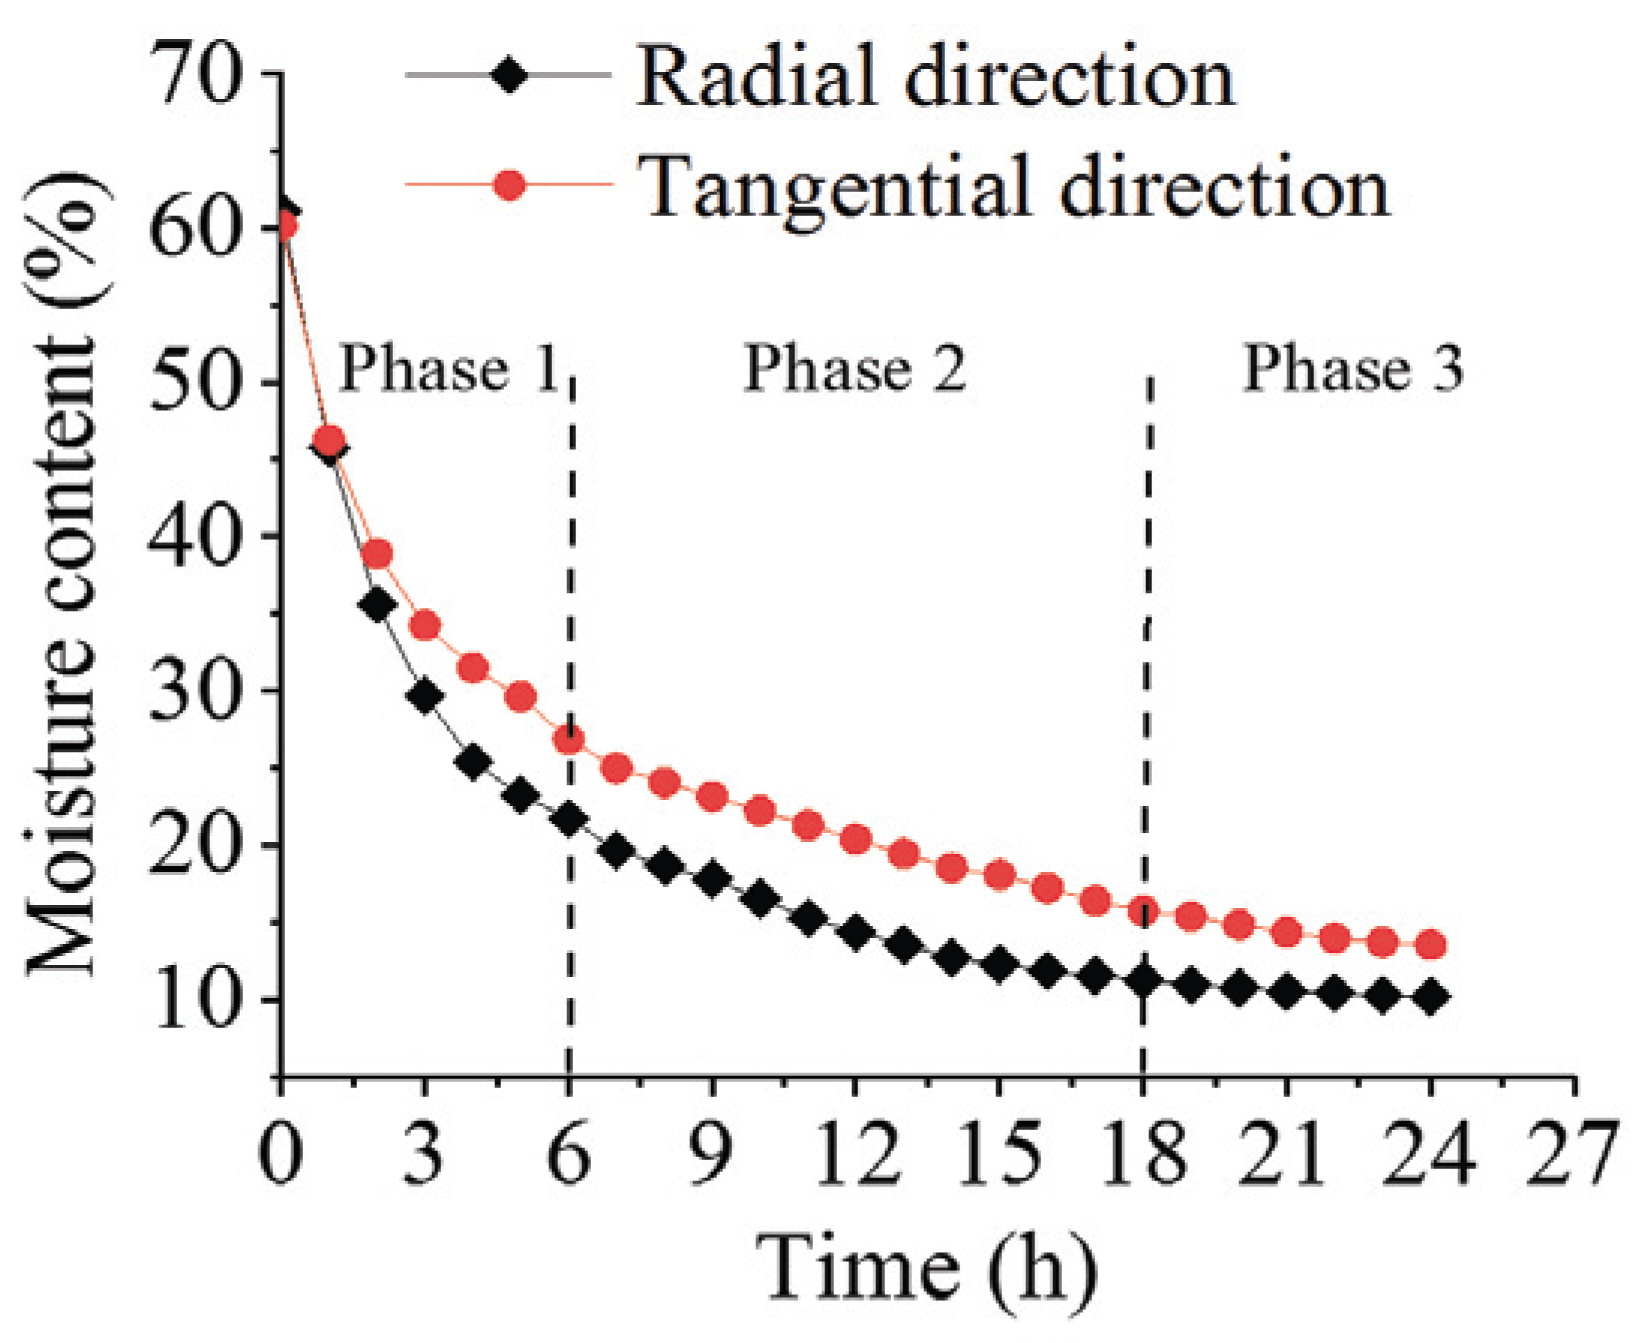
Fig. 5 shows that the moisture content in the two directions decreases continuously with time. In the curves of desorption, it can be seen that the moisture content decreases rapidly in the initial time. Within the first six hours, in the radial direction, the moisture decreased from 60 to 22%, whereas it diminished from 60 to 27% in the tangential direction. At the end of the desorption process (24 hours), the moisture content reached almost 10% and 14% in the radial and tangential directions respectively.

In the desorption curves, we can distinguish three phases. During the first phase, the samples moisture content loss is very fast; this can be explained by the elimination of the free water through the lumens and pits of the wood structure. The second phase is characterized by a reduction of loss velocity of the moisture content; the wood samples are in the hygroscopic region (below the FSP), where the bound water and water vapor are transferred. The third phase is characterized by a very slowdown of desorption which practically becomes zero. This is mainly due to the nearness of the moisture content of samples with that of the surrounding air.
According to the radial and tangential directions in absorption and desorption processes, the water diffusion coefficient of wood samples was calculated from equation (6). The mean values of the water diffusion coefficient in two directions in both processes and the average of their variation coefficients were reported in Table 4. The results show that the average values of the diffusion coefficient in desorption are higher than those of absorption in the two directions. We also noted that these coefficients are larger in the radial direction than in the tangential direction for both diffusion processes. These results are similar to those reported by other authors for other wood species (Siau, 1995; Khouya, 2008).
|
Radial direction D × 10-9 (m2s-1) |
CV (%) |
Tangential direction D × 10-9 (m2s-1) |
CV (%) |
|
|---|---|---|---|---|
| Absorption | 1.02 | 2.00 | 0.96 | 2.10 |
| Desorption | 2.30 | 2.20 | 1.19 | 1.70 |
Fig. 6 shows the drying kinetics of E. globulus wood concerning the two drying schedules described above (tests 1 and 2). It presents the evolution of the average moisture of wood as a function of time according to the conditions imposed for each test. The results obtained show that the program of drying test 1 reduce the average moisture content in wood boards from 56 to 12 % during 222 h. However, the second drying test was more accelerated to reduce the wood moisture content from 56 to 12% in the drying cycle of 174 h. It should be noted that a good drying process must take into account the quality of the final product and the energy consumed. Therefore, drying E. globulus wood according to the conditions in test 1 provides the best results concerning dried wood quality.
The measurement of the boards splits before and after drying showed that the drying tests 1 and 2 reduce the deformation and degree of cracks in E. globulus wood. The value of splitting indicator (ΔIe) in test 1 (0.25%) is less than that obtained in test 2 (10.43%).
The analysis of the values of different bows classes, before and after drying, is reported in Table 5. This table indicates that the drying tests affect bows values. The more important variations are observed for test 1.
4. CONCLUSION
We have investigated the absorption and desorption kinetics of water in the E. globulus wood in the radial and tangential directions. We also have determined the diffusion coefficients for this wood. The results show that E. globulus wood has a slightly higher diffusivity in the radial direction than in the tangential direction. The average values of the diffusion coefficient in the radial direction are larger than that of the tangential direction in both of absorption and desorption process. Drying tests done on E. globulus wood shows that the appropriate drying conditions for this wood correspond to the drying schedule 1 (Table 2). This later also reduce the deformations during the drying process.


