Journal of the Korean Wood Science and Technology
The Korean Society of Wood Science & Technology
Original Article

Sound Absorption Rate and Sound Transmission Loss of Wood Bark Particle

Chun-Won Kang2, Eun-Suk Jang2, Sang-Sik Jang3,, Ho-Yang Kang3, Seog-Goo Kang3, Se-Chang Oh4
2Department of Housing Environmental Design, and Research Institute of Human Ecology, College of Human Ecology, Chonbuk National University, Jeonju 54896, Republic of Korea
3Department of Forest Products, College of Agriculture & Life Sciences, Chungnam National University, Daejeon 34134, Republic of Korea
4Department of Forest Biomaterials Engineering, College of Agriculture, Daegu University, Daegu 38453, Republic of Korea
Corresponding author: Sang-Sik Jang (e-mail: ssjang@cnu.ac.kr, ORCID: 0000-0002-3124-7044)

© The Korean Society of Wood Science & Technology.

Received: May 02, 2019; Accepted: Jul 04, 2019

Published Online: Jul 25, 2019

Abstract

In this study, sound absorption capability and sound transmission loss of several kinds of target densities and thickness for six species of wood bark particle were estimated by the transfer function and transfer matrix methods. Resultantly, the mean sound absorption coefficient of a 100-mm thick Hinoki wood bark particle mat was 0.90 in the frequency range of 100–6400 Hz, whereas the mean sound absorption rate of a 50-mm thick Hinoki wood bark particle mat was 0.84 in the same frequency range. Particularly, at a thickness of 100 mm, it reached almost up to 100% in the frequency range of 1 KHz. The sound transmission losses of 100-mm thick Hinoki wood bark particle mat with a target density of 0.16 at 500 and 1000 Hz were 15.30 and 15.73 dB, respectively. When a 10-mm thick plywood was attached to the back of the wood particle mat, the sound transmission losses was increased by 20–30 dB. Wood bark can be used as an acoustical material owing to its high sound absorption rate and transmission loss.

Keywords: wood bark particle; sound absorption coefficient; sound transmission loss; apparent density; thickness; transfer function method; transfer matrix method

1. INTRODUCTION

With the recent improvement in the quality of life, environmental noise has become a serious issue; therefore, there is a growing demand for the noise control (Jang et al., 2018; Kim et al., 2012; Kook et al., 2007; Lee et al., 2011; Hwang et al., 2013). Several studies have investigated construction materials with an excellent sound absorption rate, methodologies for determining sound absorption rates, and sound insulation materials. Additionally, the unstable supply of industrial resources and an increase in the global effort on the reduction of greenhouse gases have led to a growing interest in recycling. South Korea, a country with a small land area and insufficient natural resources, should aim to save all its resources and develop recycling technologies for efficiently using various industrial byproducts (Kang et al., 2018a; Kang et al., 2018b; Kang et al., 2019).

Sound absorption dissipates sound energy for reducing reverberation and controls the reverberation time of a room. Sound absorbing materials should offer a high sound absorption rate, with little or no adverse effect on humans.

Sound insulation is required to block indoor noise and establish excellent indoor sound environment; its performance can be evaluated based on the sound transmission loss (STL), ratio of the intensity of incident sound to transmitted sound, and the transfer matrix method, and the reverberation method are often used to measure STL. By measuring STL using an impedance tube, the transfer matrix method is advantageous from the viewpoint of time, cost, space, and size of specimens; therefore, it is often used in rapid evaluations of STL during the development of sound materials. The reverberation method requires a large space and substantial amount of test materials, time, and cost; however, it offers more reliable results.

Meanwhile, wood bark is a byproduct obtained from processing wood materials. While there are differences in the wood species, approximately 10%–20% of wood materials are generated as wood bark worldwide, and wood bark can be considered as eco-friendly biomass owing to the little contamination in the process. However, wood barks have large difference in chemical components, and the shape of the particles is complex; therefore, its added value is rarely recognized. It is often used for additional materials for agricultural compost or fuel materials as low value-added materials.

To improve the usability of wood bark, Anderson et al. (1974) aimed to produce wood bark particle boards. Lee (1977) analyzed the physical and anatomical properties of pine, oak, and poplar trees, such as density, strength, heat, and moisture, and reported that there were substantial differences between the properties of different wood species. Mun and Kim (1994) reported that the pine wood bark has less fiber content and large amount of lignin extracts and ash content. Kim and Lee (2006) showed that Larch, nut pine, and pitch pine wood bark could be used as carbides after a 4-h process at 400°C. Additionally, Lee (1989) measured and reported the dynamic properties of oak wood bark using wood bark boards with a specific density ranging between 0.94 and 1.03. Although there have been some researches on wood bark properties and its potential as construction materials, but, to the best of our knowledge, no study has been conducted on the acoustic properties of wood bark particles.

In this study, wood barks of three different Korean tree species were used for comparison along with Douglas-fir, Radiata pine, and Hemlock wood barks, which are usually processed at a sawmill located in Gimje. Six kinds of wood bark, including five needleleaf trees and one broadleaf tree, were used herein. Several wood barks with different thickness and density were filled in sample holders, which were assumed to be wood bark mats. The vertical incident sound absorption rate was measured by the transfer function method, and the STL coefficients were measured by the transfer matrix method. In this way, the sound absorption performance and transmission loss of wood bark were determined, and its potential as construction materials or road sound insulation materials were examined.

2. MATERIALS and METHODS

2.1. Wood bark filling

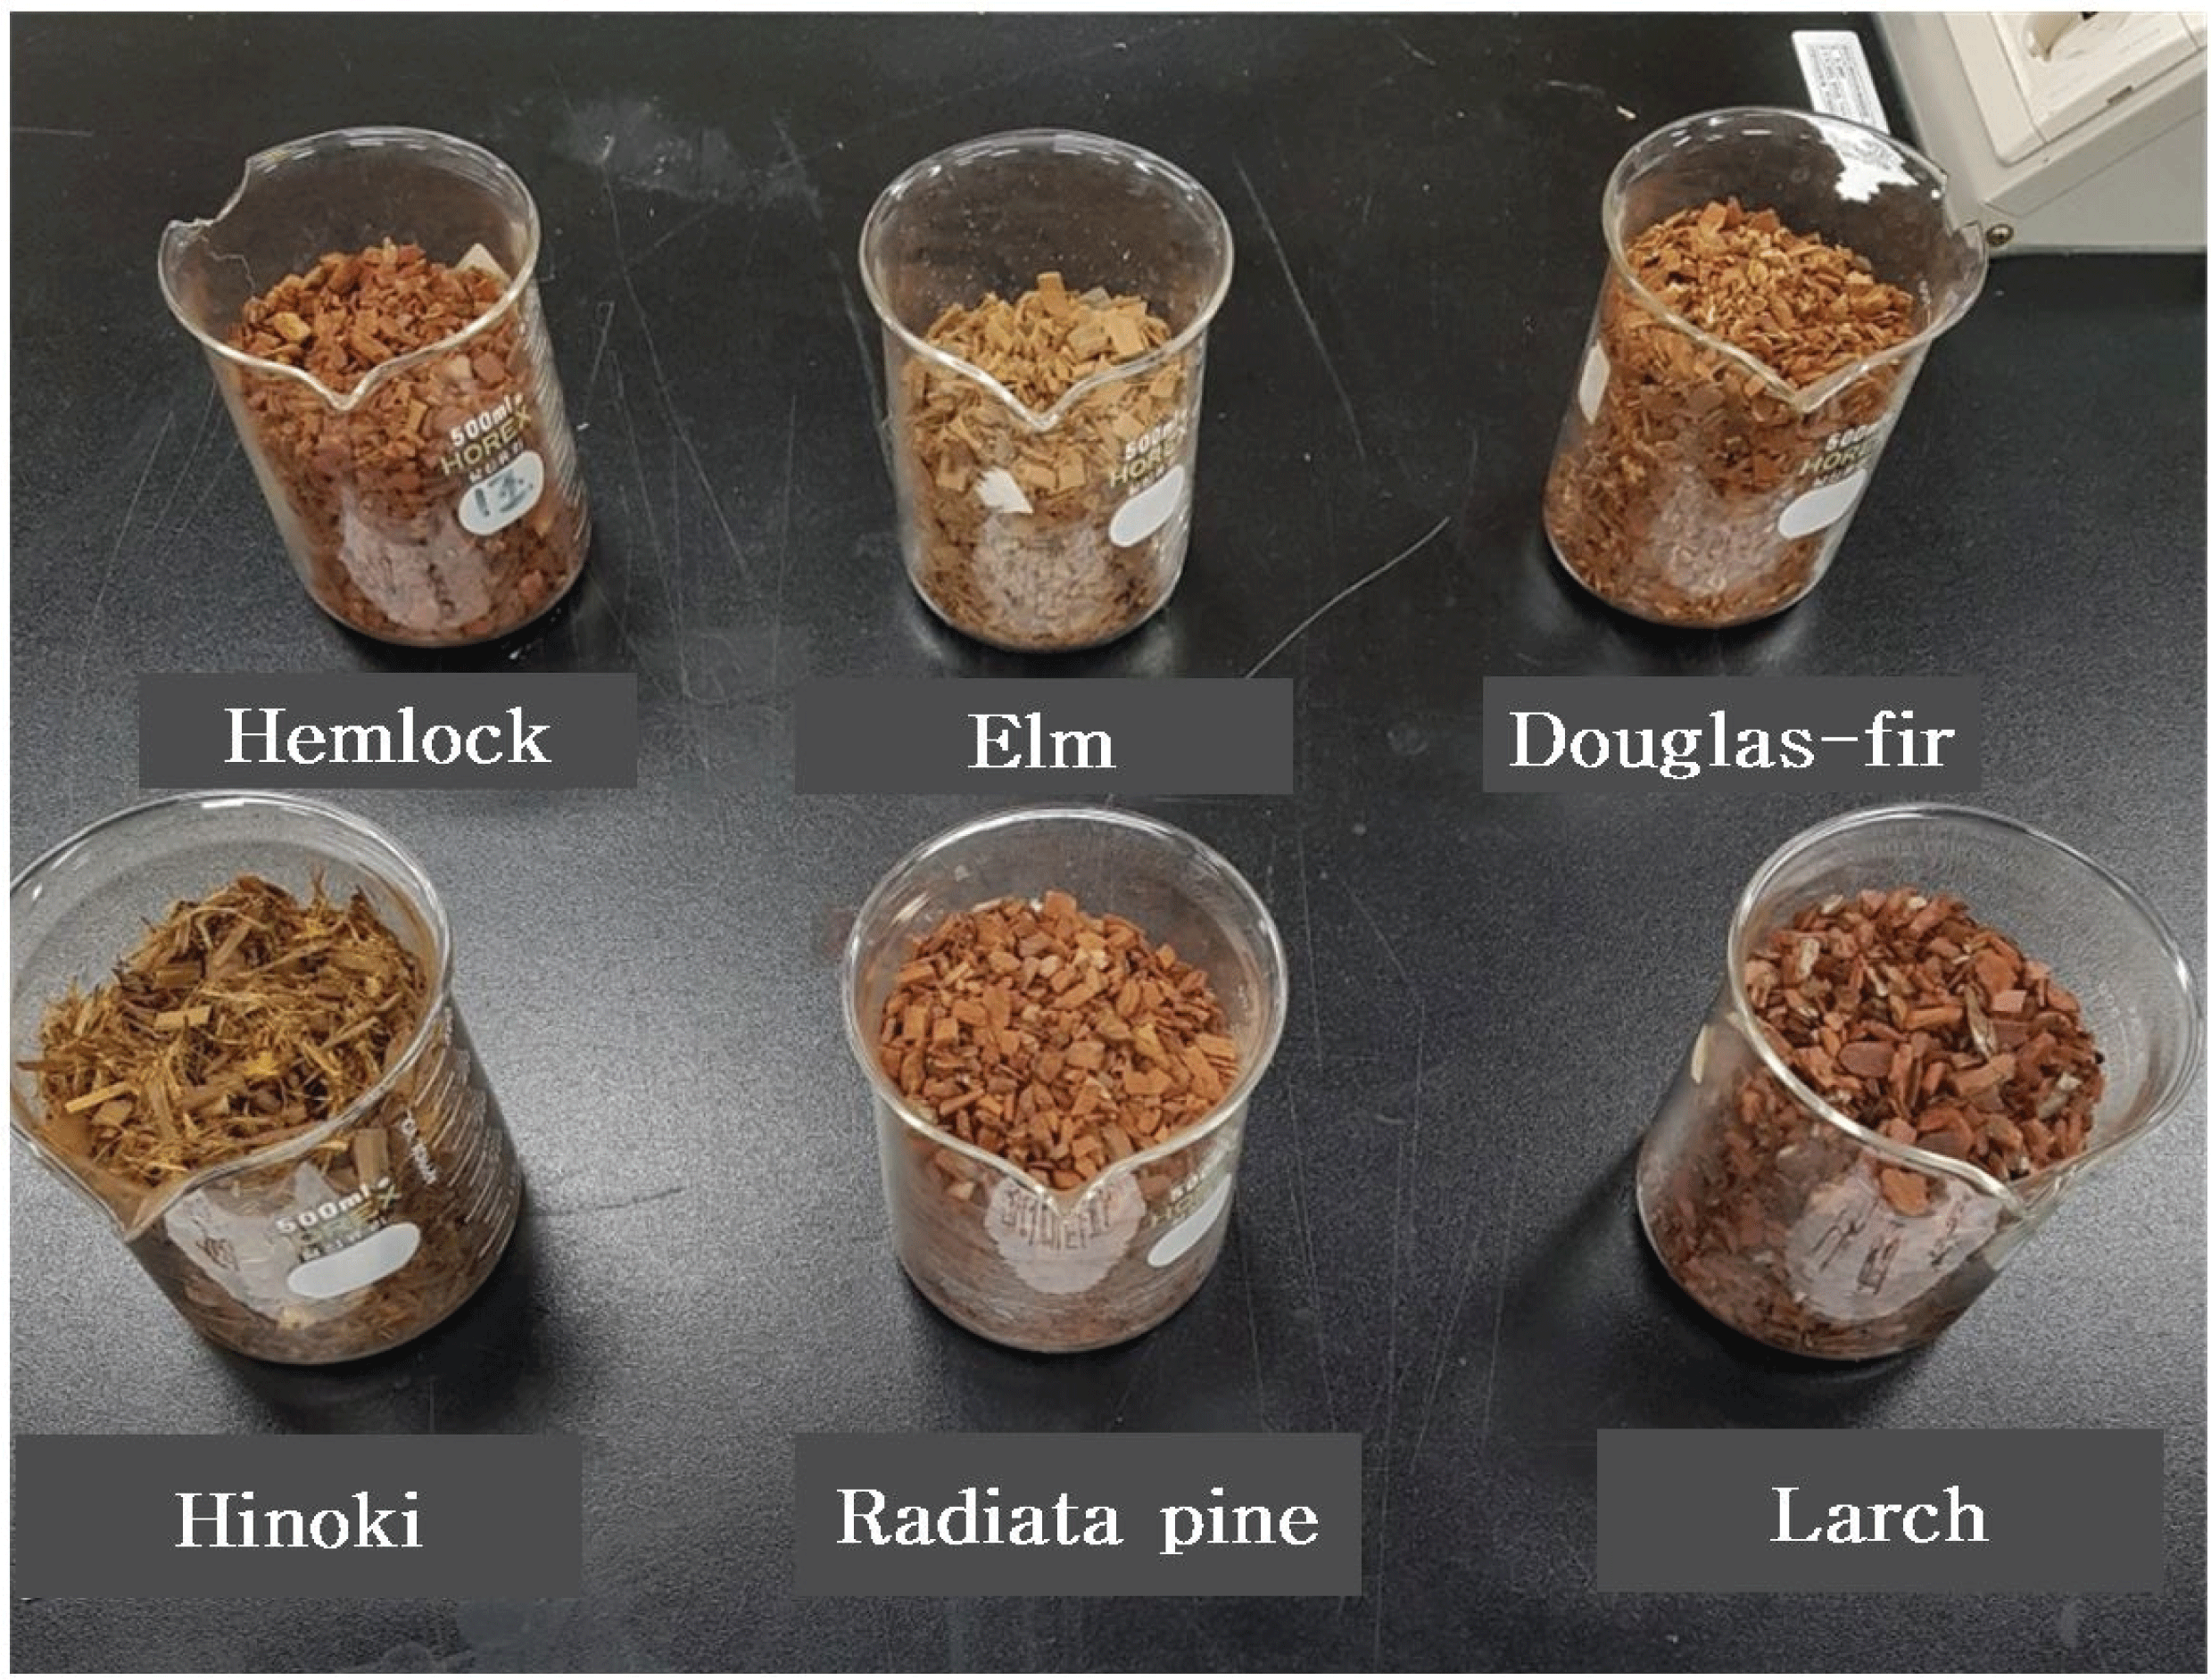
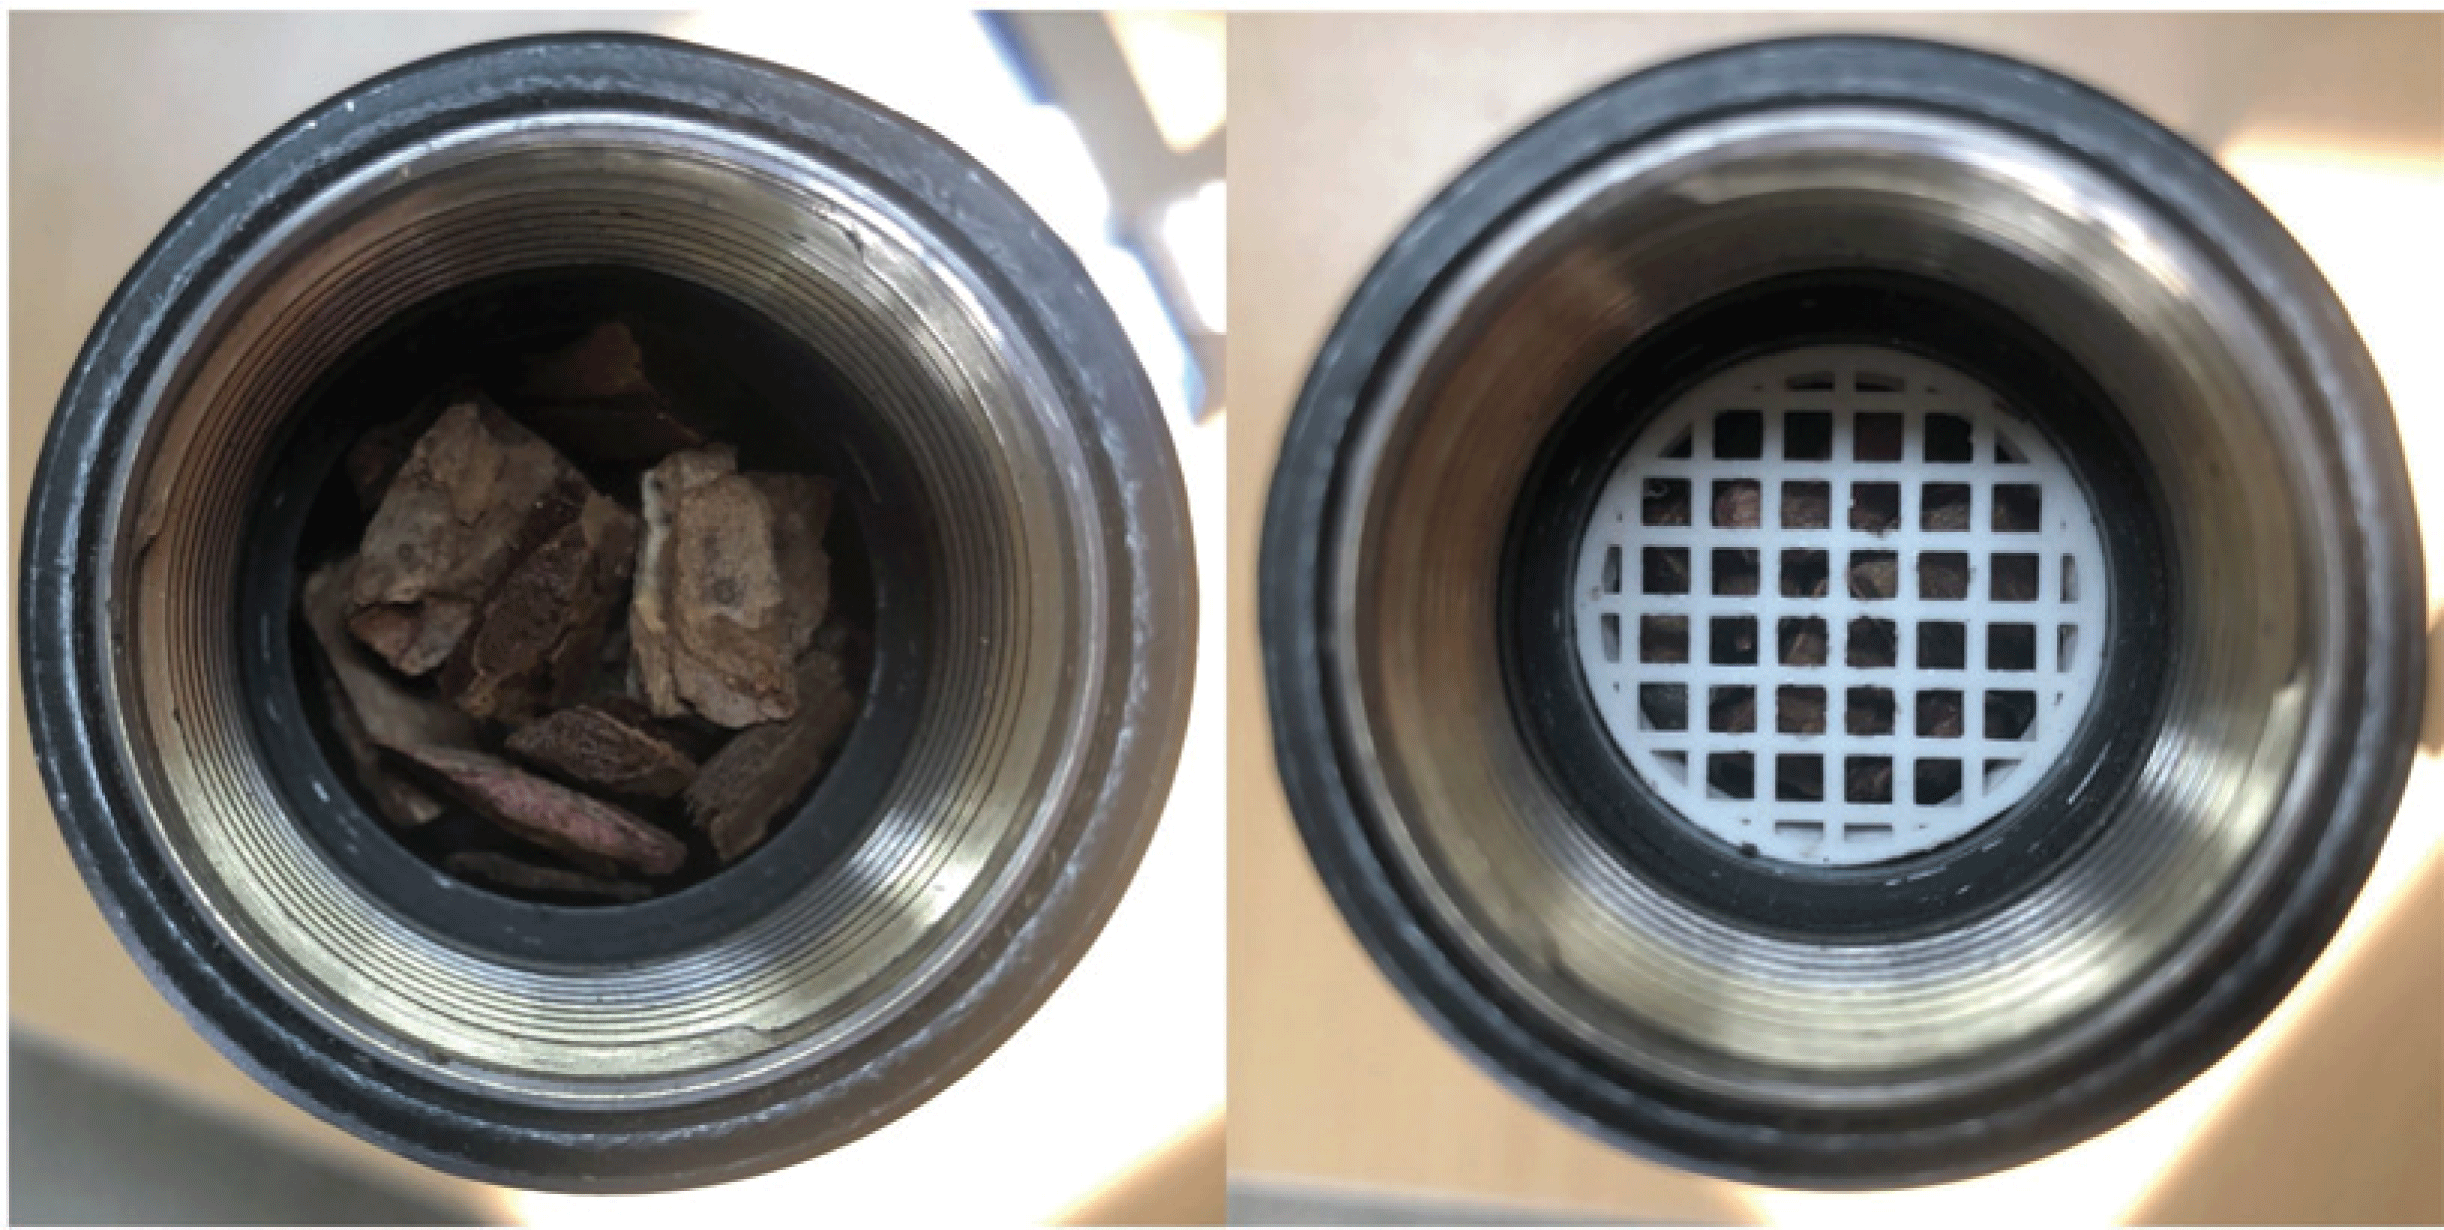
As shown in Fig. 1, six species of wood bark particles were grinded with a coffee grinder for the same amount of time to control the size of particles. The resulting wood bark particles were filled into an impedance tube, as shown in Fig. 2. The target thickness of the wood bark matt was determined by the pressure of the sample holder knob at the back of the tube controlled to achieve the target density and the back knob of the sample holder fixed to a certain thickness; this thickness was presented for the measurement of the sound absorption rate and STL. Herein, to prevent wood bark from sliding down due to gravity, a circular net obtained using a 3D printer, as shown in Fig. 2, was installed at the front to measure the vertical incident sound absorption rate.
wood-47-4-425_F1
Fig. 1. Wood bark particles of Hemlock, Elm, Douglas-fir, Hinoki, Radiata-pine and Larch wood.
Download Original Figure
wood-47-4-425_F2
Fig. 2. Sample preparation for measuring sound absorption ratio and sound transmission loss.
Download Original Figure
2.2. Measurement of the sound absorption rate by the transfer function method

As described in a previous study (Kang et al., 2019), sound absorption rates were measured by the ISO 10534-2 transfer function method using an impedance tube, pulse analyzer, and spectrum analyzer (B&K Co.). Owing to the frequency limitation of the impedance tube, 29- and 99-mm tube is used for high and low frequency ranges, respectively. Herein, the 29-mm tube was used to measure the sound absorption rate as a function of the frequency in the range 100–6400 Hz.

During the measurement, temperature, relative humidity, and air pressure were 19.90°C, 39.00%, and 1032.00 hPa, respectively, and the sound speed, air density, and sound impedance were 343.18 m/s, 1.225 kg/m3, and 420.3 Pa/(m/s), respectively.

2.3. Transmission loss measurement by the transfer matrix method

As described in a previous study (Kang et al., 2018b), transmission loss measurement was conducted using the impedance tube, pulse analyzer, and spectrum analyzer (B&K Co.) based on the transfer matrix method of ASTM E2611–09. A 29-mm impedance tube was used to measure the transmission loss in the frequency range 100–6400 Hz. During the measurement, external temperature and air pressure were 24.1°C and 1027.50 hPa, respectively.

3. RESULTS and DISCUSSION

3.1. Sound absorption rate by the transfer function method

The sound absorption rates of wood bark matts with thicknesses of 20, 30, 50, 80, or 100 mm with a specific density of 0.12 in the frequency range 100–6400 Hz is shown in Fig. 3. For 100-mm thickness, the mean sound absorption rate was 0.77 for Larch (Larix kaempferi), 0.93 for Hinoki (Chamaecyparis obtusa), 0.50 for Radiata pine (Pinus Radiata), 0.59 for Douglas-fir (Pseudotsuga menziesii), 0.56 for Elm (Zelkova serrata), and 0.58 for Hemlock (Tsuga heterophylla Sargent), and the NRC was 0.57 for Larch, 0.80 for Hinoki, 0.24 for Radiata pine, 0.31 for Douglas-fir, 0.30 for Elm, and 0.30 for Hemlock.
wood-47-4-425_F3
Fig. 3. Sound absorption rate of wood bark mat with apparent density of 0.12 (Graph legend values denote sample thickness).
Download Original Figure

The sound absorption rates of wood bark matts determined in the frequency range 100–6400 Hz using the transfer function method are shown in Fig. 4. The specific density was 0.14 and thickness was 20, 30, 50, 80, or 100 mm. The thickness of aluminum frame sound insulation walls often used for highway sound insulation walls is approximately 100 mm. At 100-mm thickness, the mean sound absorption rate was 0.80 for Larch, 0.93 for Hinoki, 0.60 for Radiata pine, 0.67 for Douglas-fir, 0.56 for Elm, and 0.65 for Hemlock, and the NRC was 0.66 for Larch, 0.81 for Hinoki, 0.32 for Radiata pine, 0.41 for Douglas-fir, 0.30 for Elm, and 0.39 for Hemlock.
wood-47-4-425_F4
Fig. 4. Sound absorption rate of wood bark mat with apparent density of 0.14 (Graph legend values denote sample thickness).
Download Original Figure

The sound absorption rates of wood bark matts measured in the frequency range 100–6400 Hz using the transfer function method are shown in Fig. 5. The density was 0.16 and thickness was 20, 30, 50, 80, or 100 mm. At 100-mm thickness, the mean sound absorption rate was 0.84 for Larch, 0.90 for Hinoki, 0.64 for Radiata pine, 0.70 for Douglas-fir, 0.62 for Elm, and 0.71 for Hemlock, and NRC was 0.70 for Larch, 0.82 for Hinoki, 0.40 for Radiata pine, 0.47 for Douglas-fir, 0.33 for Elm, and 0.45 for Hemlock.
wood-47-4-425_F5
Fig. 5. Sound absorption rate of wood bark mat with apparent density of 0.16 (Graph legend values denote sample thickness).
Download Original Figure

The sound absorption rates of wood bark matts using the transfer function method are shown in Fig. 6. The specific density was 0.12 and thickness was 50, 80, or 100 mm, and the frequency range was 100– 6400 Hz. To the back of all matts, 10-mm thick plywood was attached. At 100-mm thickness, the mean sound absorption rate was 0.73 for Larch, 0.94 for Hinoki, 0.54 for Radiata pine, 0.61 for Douglas-fir, 0.53 for Elm, and 0.56 for Hemlock, and the NRC was 0.54 for Larch, 0.80 for Hinoki, 0.30 for Radiata pine, 0.34 for Douglas-fir, 0.27 for Elm, and 0.32 for Hemlock.
wood-47-4-425_F6
Fig. 6. Sound absorption rate of 10mm thick plywood attached wood bark mat with apparent density of 0.12 (Graph legend values denote sample thickness).
Download Original Figure

The sound absorption rates of wood bark matts using the transfer function method is shown in Fig. 7. The specific density was 0.14 and thickness was 50, 80, or 100 mm in the frequency range of 100–6400 Hz. To the back of all matts, 10-mm thick plywood was attached. At 100-mm thickness, the mean sound absorption rate was 0.84 for Larch, 0.90 for Hinoki, 0.56 for Radiata pine, 0.64 for Douglas-fir, 0.57 for Elm, and 0.63 for Hemlock, and the NRC was 0.63 for Larch, 0.82 for Hinoki, 0.32 for Radiata pine, 0.39 for Douglas-fir, 0.30 for Elm, and 0.38 for Hemlock.
wood-47-4-425_F7
Fig. 7. Sound absorption rate of 10mm thick plywood attached wood bark mat with apparent density of 0.14 (Graph legend values denote sample thickness).
Download Original Figure

The sound absorption rates of wood bark matts measured using the transfer function method is shown in Fig. 8. The specific density was 0.16 and thickness was 50, 80, or 100 mm in the frequency range of 100– 6400 Hz. To the back of all matts, 10-mm thick plywood was attached. At 100-mm thickness, the mean sound absorption rate was 0.83 for Larch, 0.90 for Hinoki, 0.60 for Radiata pine, 0.68 for Douglas-fir, 0.63 for Elm, and 0.67 for Hemlock, and the NRC was 0.65 for Larch, 0.86 for Hinoki, 0.39 for Radiata pine, 0.42 for Douglas-fir, 0.34 for Elm, and 0.43 for Hemlock.
wood-47-4-425_F8
Fig. 8. Sound absorption rate of 10 mm thick plywood attached wood bark mat with apparent density of 0.16 (Figure legend values denote sample thickness).
Download Original Figure

It is believed that the reason for such differences in the sound absorption rate of wood bark particles is because the components and shape of wood bark are different for different tree species (Lee, 1977). Accordingly, even if particles in similar size are used to create wood bark particle matts with the same target density, different air flow resistance would generate, resulting in different sound absorption performance. Air flow means that there exist penetrating pores. Li et al. (2014) reported that penetrating pores have a decisive impact on the sound absorption behavior and air flow resistance; therefore, it is important to appropriately increase the number and size of pores in improving the sound absorption properties lower frequency ranges where the sound absorption performance is low due to the reduction of the air flow resistance.

Overall, as the apparent specific density increases from 0.12 to 0.16, the mean sound absorption rate increased by 0.10 and 0.081 at 50 and 100 mm thickness, respectively.

The mean sound absorption rate with plywood was 0.37–0.94, and without plywood, it was 0.20–0.93, which is decrease of approximately 9.5%. At 100-mm thickness, the mean sound absorption rate of wood bark in the range 100–6400 Hz was 0.70. When the thickness of wood bark and plywood is 100 mm, it was 0.69.

Meanwhile, the NRC of the ceiling gypsum board used often in offices and lecture halls was approximately 0.30, and most wood bark matts in 100 mm herein were over 0.30, except 0.24 and 0.27 from Radiata pine and Elm, respectively, with the density of 0.12; therefore, they showed superior performance than the gypsum board. Particularly, the sound absorption coefficient was over 0.80 in Hinoki wood bark with the density of 0.16 and thickness of 10cm. Therefore, it is believed that the Hinoki wood bark particle with the density of 0.16 could be used as sound absorbing mat. In addition, further research on the sound absorp tion performance of oriental oak wood bark, which offers a high wood bark ratio, should be conducted for the high added value use of Korean species of trees.

3.2. STL by the transfer matrix method

The STL data from six species of wood bark and wood bark matts whose apparent specific density was 0.12, 0.14, and 0.16 is shown in Fig. 9. At a specific density of 0.12, the mean STL in the frequency range of 100–6400 Hz was 6.37 dB for Larch, 12.46 dB for Hinoki, 2.06 dB for Radiata pine, 2.41 dB for Douglas-fir, 1.69 dB for Elm, and 2.50 dB for Hemlock. At a specific density of 0.14, the mean STL in the frequency range 100–6400 Hz was 13.44 dB for Larch, 19.50 dB for Hinoki, 1.39 dB for Radiata pine, 3.63 dB for Douglas-fir, 2.38 dB for Elm, and 3.27 dB for Hemlock. At a specific density of 0.16, the mean STL in the frequency range 100–6400 Hz was 18.81 dB for Larch, 26.95 dB for Hinoki, 4.16 dB for Radiata pine, 5.25 dB for Douglas-fir, 3.31 dB for Elm, and 4.03 dB for Hemlock.
wood-47-4-425_F9
Fig. 9. Sound transmission loss of 100mm thick wood bark mat (Graph legend values denote apparent density of wood bark mat).
Download Original Figure

Wood bark particle matts from Radiata pine, Douglas-fir, Elm, and Hemlock showed low STL at or below 5 dB in the frequency range even after the increase of the apparent specific density from 0.12 to 0.16 due to the pores between wood bark particles. On the contrary, the wood bark particle matts from Larch with a specific density of 0.12 showed a STL between 5 and 9 dB, which was somewhat higher than those of Radiata pine, Douglas-fir, Elm, and Hemlock. However, the wood bark particle matts of Hinoki showed a STL higher by more than two times than Radiata pine, Douglas-fir, Elm, and Hemlock showing the loss of 5–10 dB at 100–1000 Hz, 10–15 dB at 1000–4000 Hz, and 15–20 dB at 4000–6400 Hz, respectively. When the apparent specific density was increased to 0.16, Larch wood bark particles showed a loss of 8–12 dB at 100–1000 Hz, 15–20 dB at 1000– 4000 Hz, and 20–30 dB at 4000–6400 Hz, and Hinoki wood bark particles showed the loss of 13–15 dB at 100–1000 Hz, 15–30 dB at 1000–4000 Hz, and 25–40 dB at 4000–6400 Hz. The reason for such high STL of Larch and Hinoki wood bark particles in comparison with other species of wood is because their wood bark is thin and dense. The apparent specific density is increased by applying pressure, and small and thin particles are tightly attached together to reduce or stop air flow, which increases the STL. As the frequency increases, the STL increased as well. The STL of wood bark particles was generally between 0 and 20 dB, making it difficult to expect sound insulation performance.

The STL of six species of wood bark with plywood whose apparent specific density was 0.12 and 0.16 is shown in Fig. 10. At a specific density of 0.12, the mean transmission loss at 100–6400 Hz was 37.36 dB for Larch, 45.99 dB for Hinoki, 38.87 dB for Radiata pine, 33.54 dB for Douglas-fir, 38.76 dB for Elm, and 38.11 dB for Hemlock. At specific density of 0.16, the mean transmission loss at 100–6400 Hz was 46.80 dB for Larch, 48.35 dB for Hinoki, 36.41 dB for Radiata pine, 38.54 dB for Douglas-fir, 38.79 dB for Elm, and 38.17 dB for Hemlock. With a drastic increase in the transmission loss than the wood bark particle matts, the loss at or below 1000 Hz was approximately 30 dB, and above 1000 Hz, it increased to 30–50 dB. Overall, it increased by approximately 20 to 30 dB. Therefore, it is believed that the addition of plywood would offer better sound insulation performance.
wood-47-4-425_F10
Fig. 10. Sound transmission loss of 10mm thick plywood attached 50mm thick wood bark mat (Graph legend values denote apparent density of wood bark mat).
Download Original Figure

4. CONCLUSION

Herein, the sound absorption performance of wood bark was measured by changing its apparent specific density and thickness, and the results were compared to the specimens attached with plywood. Plywood was attached to the wood bark with the specific apparent specific density and thickness whose sound absorption performance was shown to be excellent in the sound absorption rate measurement results, and its STL was measured and compared with the transfer matrix method. Therefore, the study resulted in the following conclusions:

  1. It was determined that wood bark offered a higher sound absorption rate than existing gypsum boards; therefore, it could be used as sound absorbing materials.

  2. The STL of wood bark was low, but after plywood was attached at the back of wood bark matts, it increased by 20-30 dB.

  3. It was determined that by adjusting the thickness and apparent specific density and attaching plywood at the back, wood bark particle matts would offer excellent sound absorption and insulation performance; therefore, they could be used as acoustic materials for building projects or sound insulation materials for road noise reduction.

ACKNOWLEDGMENT

This study was carried out with the support of R&D Program for Forest Science Technology (Project No. 2017050C10-1719-BB02)´ provided by Korea Forest Service (Korea Forestry Promotion Institute).

Appendices

APPENDIX (Korean Version)
목재수피 파티클의 흡음율과 음향투과손실

초록 : 목재수피의 음향성능을 파악하고자 6가지 수종의 목재수피를 삭편으로 절삭하여 몇 가지 비중조건과 두께로 만든 후 흡음율과 음향투과손실을 전달함수법과 전달행렬법으로 각각 측정하였다. 그 결과, 편백나무수피가 두께 100 mm 일 때의 100-6400 Hz 평균흡음율은 0.90이며 두께 50 mm 일때의 100-6400 Hz 평균흡음율은 0.84이다. 특히 두께 100 mm 일 때의 경우, 1 KHz의 주파수영역에서의 흡음율은 약 100%에 근접하는 높은 흡음율을 나타내었다. 음향투과손실은 측정주파수범위에 서 편백나무수피는 500 Hz에서 15.30 dB의 투과손실을 나타내었고 1000 Hz 수치는 15.73 dB이었다. 10 mm 두께의 합판을 수피파티클 배면에 추가한 후에는 투과손실이 20–30 dB 증가하였다. 목재수피는 친환경적이면서 기존의 석고보드보다 흡음율 이 높고 음향투과손실이 크게 나타나서 음향성능이 우수한 건축재료로 고려될 수 있다고 생각된다.

1. 서 론

최근 삶의 질 향상에 대한 관심이 고조되어 환경소음문제가 심각해지고 있으며 소음제어에 대한 요구가 증가하고 있다 (Jang et al., 2018; Kim et al., 2012; Kook et al., 2007; Lee et al., 2011; Hwang et al., 2013). 이에 따라 흡음율이 우수한 건축자재에 대한 연구와 흡음율 측정에 관한 연구가 증가하고 있으며 차음재에 대한 연구도 증가하고 있다. 또한 전 세계적으로 산업자원의 수급불안정 및 기후환경변화에 따른 온실가스 감축에 대한 관심 증대로 부산물재활용에 대한 관심이 높고 특히 국토가 좁고 천연자원이 부족한 우리나라는 모든 자원을 최대한 절약하며 사용해야 하고 각종 산업 부산물을 효율적으로 재이용하는 기술이 필요하다(Kang et al., 2018a; Kang et al., 2018b, Kang et al., 2019).

흡음은 음이 가지고 있는 에너지를 소실 또는 감소시켜 잔향을 감소시키는 기능을 하여 실의 잔향시간을 조절한다. 흡음재료 는 높은 흠음율을 나타내면서 인체에 나쁜 영향이 적거나 없는 재료이어야 한다.

차음은 실내소음을 차단하는 기능을 하며 우수한 실내음향환경 조성을 위해 필요한 기능이다. 차음의 성능척도는 투과음에 대한 입사음의 강도비에 대수를 취한 음향투과손실로 나타내며 이의 평가에 전달행렬법과 잔향실법이 주로 이용되고 있는데 임피던스관을 이용하여 적은 재료로 신속하게 측정하는 전달행렬법은 시간, 비용, 공간 그리고 시험재료의 크기 등의 면에서 유리하여 음향재료 개발 시의 신속한 평가 등에 이용되고 잔향실법은 큰 공간과 시험재료 그리고 장소 등이 필요하고 시간과 비용이 많이 소요되지만 신뢰성의 측면에서는 우위에 있다.

한편, 수피는 목재를 생산할 때 얻어지는 부산물로서 수종에 따라 차이는 있으나 임목재적의 10-20%에 상당하는 분량의 수피가 전 세계적으로 발생하고 생산과정에서의 오염이 적어 친환경적인 바이오매스라고 할 수 있다. 그러나 목재수피는 화학적 성분차이가 무척 크고 수피자체의 형상이 복잡하여 부가가치가 높게 이용되는 경우는 적고 대부분 부가가치가 낮은 농업용 퇴비 부성분으로 이용되거나, 혹은 부가가치가 낮은 연료재로의 사용이 대부분이다.

목재수피이용에 관하여 수피의 이용가능성을 제고하기 위해 Anderson et al. (1974)은 수피보드 제조를 시도하였다. Lee (1977)는 소나무속, 참나무속, 사시나무속의 수피의 비중, 강도, 열과 수분 등의 물리적성질과 해부학적성질을 분석하여 수종 간 차이가 크다고 보고하였다. Mun and Kim (1994)은 소나무 수피를 분석하여 섬유소물질이 적고 리그닌과 추출성분 그리고 회분이 다량으로 포함되어 있다고 보고하였다. Kim and Lee (2006)는 낙엽송, 잣나무, 리기다소나무 수피의 탄화이용에 관하여 탄화온도 400도에서 4시간 처리한 경우 탄화물로서의 이용이 가능하다고 보고하였다. 또한 Lee (1989)는 참나무류의 수피를 이용하여 비중 0.94-1.03의 수피보드를 제작하여 역학적 성질을 측정, 보고하였다. 이처럼 수피 물성을 파악하고 건축용 재료로 의 활용가능성에 대한 연구는 수행되었으나 목재수피파티클의 음향적 성질을 검토한 연구는 전례가 없다.

본 연구에서는 김제 소재 제재소에서 주로 제재하는 더글라스퍼 라디아타파인 헴록 수피와 비교목적으로 국산수종 3수종의 수피를 추가하여 침엽수 5수종과 활엽수 1수종, 도합 6수종의 목재수피를 이용하여 두께와 밀도를 달리한 몇 가지 종류의 목재수피를 샘플홀더에 충전하여 목재수피매트라 가정하고 전달함수법으로 수직입사흡음율을 측정하고, 전달행렬법으로 음향 투과손실계수를 측정하였다. 이를 통하여 목재수피의 흡음성능과 투과손실을 파악하고 건축용재 또는 도로방음벽 재료로의 이용가능성을 검토하였다.

2. 재료 및 방법
2.1. 목재수피충전

Fig. 1과 같은 6 수종의 수피파티클을 커피분쇄기로 동일한 시간동안 분쇄하여 비슷한 크기로 조절하였다. 이렇게 얻은 수피파티클을 Fig. 2와 같이 충전할 때 부피에 의해 정해지는 겉보기비중만큼의 무게의 목재수피를 임피던스튜브에 넣고 후면의 샘플홀더 노브로 누르는 압력을 조절하여 목표비중을 달성하고 샘플홀더 후면 노브를 일정 두께로 고정하여 목표 두께의 목재수피매트라고 가정하여 흡음율과 음향투과손실 측정에 공시하였다. 이때 목재수피가 중력으로 흘러내리는 것을 방지하기 위하여 Fig. 2와 같은 3D프린터로 제작한 원형그물을 전면에 설치하고 수직입사흡음율을 측정하였다.

2.2. 전달함수법 흡음율 측정

흡음율 측정은 전보(Kang et al., 2019)와 마찬가지로 B&K사의 impedance tube, pulse분석장치 그리고 스펙트럼 아날라이저 를 이용하여 ISO 10534-2의 전달함수법(transfer function method)으로 흡음율을 측정하였다. 흡음율측정 시, 임피던스튜브를 사용하는데 임피던스튜브 직경의 주파수 제한으로 고주파수영역은 29 mm, 저주파수영역은 99.0 mm의 튜브를 이용한다. 본 연구에서는 직경 29 mm의 임피던스관을 이용하여 100-6400 Hz 구간의 주파수변화에 따른 흡음율 변이를 측정하였다.

측정 시 외부조건은 온도, 상대습도, 기압이 각각, 19.90°C, 39.00%, 1032.00 hPa이었고 음속, 공기밀도 그리고 음향임피던스 는 각각 343.18 m/s, 1.225 kg/m3, 420.3 Pa/(m/s)이었다.

2.3. 전달행렬법 투과손실측정

투과계수 측정은 전보 (Kang et al., 2018b)와 마찬가지로 B&K사의 impedance tube와 pulse 분석장치 그리고 스펙트럼 아날라이저를 이용하여 ASTM E2611 – 09의 전달행렬법 (transfer matrix method) 으로 측정하였다. 측정 시, 직경 29 mm의 임피던스튜브를 이용하여 100-6400 Hz범위의 주파수대역에서 투과손실을 측정하였으며 측정 시 외부조건은 온도, 기압이 각각, 24.1°C, 1027.50 hPa이었다.

3. 결과 및 고찰
3.1. 전달함수법 흡음율

Fig. 3에는 전달함수법으로 구한 목재수피매트의 비중이 0.12이고 두께를 20 mm, 30 mm, 50 mm, 80 mm 그리고 100 mm 로 조절한 100-6400 Hz 주파수범위에서의 흡음율을 나타내고 있다. 두께가 100 mm일 때 100-6400 Hz 평균흡음율은 낙엽송 (Larix kaempferi) 0.77, 편백 (Chamaecyparis obtusa) 0.93, 라디에타파인 (Pinus radiata) 0.50, 다글라스퍼 (Pseudotsuga menziesii) 0.59, 느티나무 (Zelkova serrata) 0.56, 햄록 (Tsuga heterophylla Sargent) 0.58 이었으며 NRC값은 낙엽송 0.57, 편백 0.80, 라디에타파인 0.24, 다글라스퍼 0.31, 느티나무 0.30, 햄록 0.30이었다.

Fig. 4에는 전달함수법으로 구한 목재수피매트의 비중이 0.14이고 두께를 20 mm, 30 mm, 50 mm, 80 mm 그리고 100 mm 로 조절한 100-6400 Hz 주파수범위에서의 흡음율을 나타내고 있다. 고속도로방음벽으로 주로 사용되는 알루미늄프레임 방음벽의 두께가 100 mm 정도인데 본 연구에서 두께가 100 mm일 때 100-6400 Hz 평균흡음율은 낙엽송 0.80, 편백 0.93, 라디에타파인 0.60, 다글라스퍼 0.67, 느티나무 0.56, 햄록 0.65 이었으며 NRC값은 낙엽송 0.66, 편백 0.81, 라디에타파인 0.32, 다글라스퍼 0.41, 느티나무 0.30, 햄록 0.39이었다.

Fig. 5에는 전달함수법으로 구한 목재수피매트의 비중이 0.16이고 두께를 20 mm, 30 mm, 50 mm, 80 mm 그리고 100 mm 로 조절한 100-6400 Hz 주파수범위에서의 흡음율을 나타내고 있다. 두께가 100 mm일 때 100-6400 Hz 평균흡음율은 낙엽송 0.84, 편백 0.90, 라디에타파인 0.64, 다글라스퍼 0.70, 느티나무 0.62, 햄록 0.71 이었으며 NRC값은 낙엽송 0.70, 편백 0.82, 라디에타파인 0.40, 다글라스퍼 0.47, 느티나무 0.33, 햄록 0.45 이었다.

Fig. 6에는 비중 0.12 목재수피매트의 배면에 10 mm두께의 합판을 부착하고 전달함수법으로 측정한 100 Hz에서 6400 Hz의 주파수범위에서의 흡음율을 나타내고 있다. 목재수피매트의 두께를 50 mm, 80 mm 그리고 100 mm로 조절하였고 두께 100 mm일 때 100-6400 Hz 평균흡음율은 낙엽송 0.73, 편백 0.94, 라디에타파인 0.54, 다글라스퍼 0.61, 느티나무 0.53, 햄록 0.56 이었으며 NRC값은 낙엽송 0.54, 편백 0.80, 라디에타파인 0.30, 다글라스퍼 0.34, 느티나무 0.27, 햄록 0.32이었다.

Fig. 7에는 비중 0.14 목재수피매트의 배면에 10 mm두께의 합판을 부착하고 전달함수법으로 측정한 100 Hz에서 6400 Hz의 주파수범위에서의 흡음율을 나타내고 있다. 목재수피매트의 두께를 50 mm, 80 mm 그리고 100 mm 로 조절하였고 두께 100 mm일 때 100-6400 Hz 평균흡음율은 낙엽송 0.84, 편백 0.90, 라디에타파인 0.56, 다글라스퍼 0.64, 느티나무 0.57, 햄록 0.63이었으며 NRC값은 낙엽송 0.63, 편백 0.82, 라디에타파인 0.32, 다글라스퍼 0.39, 느티나무 0.30, 햄록 0.38이었다.

Fig. 8에는 비중 0.16 목재수피매트의 배면에 10 mm 두께의 합판을 부착하고 전달함수법으로 측정한 100 Hz에서 6400 Hz의 주파수범위에서의 흡음율을 나타내고 있다. 목재수피매트의 두께를 50 mm, 80 mm 그리고 100 mm로 조절하였고 두께 100 mm일 때 100-6400 Hz 평균흡음율은 낙엽송 0.83, 편백 0.90, 라디에타파인 0.60, 다글라스퍼 0.68, 느티나무 0.63, 햄록 0.67이었으며 NRC값은 낙엽송 0.65, 편백 0.86, 라디에타파인 0.39, 다글라스퍼 0.42, 느티나무 0.34, 햄록 0.43 이었다. 이렇게 수피파티클의 흡음율이 목재 수종에 따라 다르게 나타나는 이유는 수피의 성분과 형상이 수종에 따라 크게 다르고(Lee, 1977) 이에 따라 비슷한 사이즈의 파티클로 목표비중을 동일하게 수피파티클 매트를 제작해도 각각의 공기흐름저항이 다르게 되어 흡음성능의 변화가 나타나게 되는 것으로 추정된다. 공기흐름은 관통공극이 존재함을 의미하는데 Li et al. (2014) 는 관통공극은 흡음 거동 및 공기흐름저항에 결정적인 영향을 미치며 공극 개수의 수와 크기를 적절하게 증가시키는 것은 공기흐름저항의 감소로 인해 상대적으로 낮은 주파수에서의 흡음 특성을 개선시키는데 유익하다고 보고한 바 있다.

전체적으로 겉보기비중이 0.12에서 0.16로 증가함에 따라 두께 50 mm 에서는 0.10 정도 두께 100 mm에서는 0.081정도 평균흡음율이 증가하는 경향을 나타내었다.

합판을 부착하였을 때 평균흡음율이 0.37-0.94 정도로 합판을 부착하지 않은 목재수피만의 평균흡음율은 0.20-0.93 정도로 합판을 부착하지 않은 경우가 약 9.5% 정도 낮았다. 목재수피는 두께 100 mm 일 때의 100-6400Hz 평균흡음율은 0.70이다. 목재수피+합판의 두께 100 mm 일 때의 100-6400 Hz 평균흡음율은 0.69이다.

한편, 사무실이나 강의실 등에 주로 사용되는 천정용 석고보드는 소음저감계수(NRC, noise reduction coefficient)가 0.30 전후의 수치를 나타내는데 본 연구에서 100 mm 두께의 대부분의 수피매트가 라디에타파인 비중 0.12의 경우 0.24, 느릅나무 비중 0.12의 경우 0.27을 제외하고 0.30 이상의 수치를 나타내어 석보보드보다 우수한 수치를 나타내고 특히 편백나무 수피 비중 0.16, 두께 10 cm의 경우 소음저감계수가 0.80 이상의 수치를 나타내었다. 향후 국산 수종의 고부가가치 이용을 위하여 수피 비율이 큰 굴참나무 수피의 흡음성능에 대한 연구가 선행되어야 할 것으로 사료되었다.

3.2. 전달행렬법 음향투과손실

Fig. 9에 6수종 목재수피와 목재수피매트의 겉보기비중이 0.12, 0.14 그리고 0.16의 경우에 두께 50 mm의 음향투과손 실을 나타내고 있다. 비중 0.12일 때 100-6400 Hz 투과손실 평균값은 낙엽송 6.37 dB, 편백 12.46 dB, 라디에타파인 2.06 dB, 다글라스퍼 2.41 dB, 느티나무 1.69 dB, 햄록 2.50 dB이었다. 비중0.14일 때 100-6400 Hz 투과손실 평균값은 낙엽송 13.44 dB, 편백 19.50 dB, 라디에타파인 1.39 dB, 다글라스퍼 3.63 dB, 느티나무 2.38 dB, 햄록 3.27 dB이었다. 비중 0.16일 때 100-6400 Hz 투과손실 평균값은 낙엽송 18.81 dB, 편백 26.95 dB, 라디에타파인 4.16 dB, 다글라스퍼 5.25 dB, 느티나무 3.31 dB, 햄록 4.03dB이었다.

라디에타파인, 다글라스퍼, 느티나무 그리고 햄록 수피파티클 매트는 겉보기비중을 0.12에서 0.16으로 증가시켜도 수피파티 클 사이의 공극이 있어서 전 주파수대역에서 5 dB 이하의 낮은 음향투과손실을 나타내었다. 반면에 낙엽송 수피파티클 매트는 겉보기비중이 0.12인 경우 라디에타파인, 다글라스퍼, 느티나무 그리고 햄록 수피파티클 매트보다 약간 높게 전 주파수대역에서 5-9 dB의 낮은 음향투과손실을 나타내었으나 편백 수피파티클 매트의 경우 100–1000 Hz 구간에서 5-10 dB, 1000-4000 Hz 구간에서 10-15 dB, 4000-6400 Hz 구간에서 15-20 dB 정도의 수치를 나타내어 라디에타파인, 다글라스퍼, 느티나무 그리고 햄록 수피파티클 매트보다 2배 이상 큰 음향투과손실을 나타내었다. 겉보기비중을 0.16으로 증가시키면 낙엽송 수피파티클의 경우 100–1000 Hz 구간에서 8-12 dB, 1000-4000 Hz 구간에서 15-20 dB, 4000-6400 Hz 구간에서 20-30 dB 정도의 수치를 나타내었고 편백 수피파티클의 경우 100–1000 Hz 구간에서 13-15 dB, 1000-4000 Hz 구간에서 15-30 dB, 4000-6400 Hz 구간에서 25-40 dB 정도의 수치를 나타내었다. 이렇게 낙엽송과 편백 수피파티클의 음향투과손실이 다른 수종보다 높은 이유는 수피 두께가 얇고 치밀하여 파티클에 압력을 가해서 겉보기밀도를 높일 경우, 작고 얇은 파티클이 서로 밀착하면서 공기흐름이 감소 또는 정지하여 음향투과손실이 증가하는 것으로 사료되었다. 주파수 변화에 따라서는 주파수가 증가할수록 음향투과손실 이 커지는 경향을 나타내었다. 목재수피 파티클의 투과손실은 대체적으로 0-20 dB 정도의 수치를 나타내어 차음효과를 기대하기 어려웠다.

Fig. 10에 6수종 목재수피+합판의 겉보기비중이 0.12 그리고 0.16의 경우에 두께 50 mm의 음향투과손실을 나타내고 있다. 비중0.12일 때 100-6400 Hz 투과손실 평균값은 낙엽송 37.36 dB, 편백 45.99 dB, 라디에타파인 38.87 dB, 다글라스퍼 33.54 dB, 느티나무 38.76 dB, 햄록 38.11 dB이었다. 비중 0.16일 때 100-6400 Hz의 투과손실 평균값은 낙엽송 46.80 dB, 편백 48.35 dB, 라디에타파인 36.41 dB, 다글라스퍼 38.54 dB, 느티나무 38.79 dB, 햄록 38.17 dB이었다. 수피파티클 매트보다 투과손실이 크게 증가하여 1000Hz이하에서는 30 dB정도의 수치를 나타내고 1000 Hz 이후부터 투과손실이 증가하여 30-50 dB의 수치를 나타내며 전체적으로 20-30 dB이 높아진 것을 알 수 있다. 따라서 합판을 추가하면 차음성능이 우수할 것으로 사료되었다.

4. 결 론

목재수피의 겉보기비중과 두께를 달리하여 흡음성능을 측정하고 합판을 부착하고 측정한 경우와 비교하였다. 흡음율측정결 과에서 흡음성능이 우수한 겉보기비중과 두께의 목재수피와 합판을 부착한 경우의 음향투과손실을 전달행렬법으로 측정, 비교 하여 다음과 같은 결론을 얻었다.

  1. 목재수피는 기존의 석고보드보다 흡음율이 높아서 흡음재로 사용 가능할 것으로 사료되었다. 합판을 배면에 부착한 경우 흡음율이 약간 증가하였다.

  2. 목재수피의 음향투과손실은 0-20 dB로 낮았으나 배면에 합판을 부가한 후 투과손실이 20-30 dB 증가하였다.

  3. 두께와 겉보기비중을 조절하고 배면에 합판을 부착하면 흡, 차음 공히 우수한 음향특성을 나타내어 건축용 음향재료 또는 도로소음감소용 방음벽 재료로 사용이 가능할 것으로 사료되었다.

REFERENCES

1.

Anderson A-B., Wong A., Wu K-T. Utilization of white fir bark in particleboard. Forest Products Journal. 1974; 24(7):40-45.

2.

ASTM E2611 - 09 Standard Test Method for Measurement of Normal Incidence Sound Transmission of Acoustical Materials Based on the Transfer Matrix Method.

3.

Hwang S-M., Kim J-D., Kwon H., Seo Y-S. Sound Transmission Loss through Double Walls. International Journal of Naval Architecture and Ocean Engineering. 2013; 50(2):64-68.

4.

ISO 10534-2 Acoustics-Determination of Sound Absorption Coefficient and Impedance in Impedance Tubes-Part 2: Transfer Function Method.

5.

Jang E-S., Kang C-W., Kang H-Y., Jang S-S. Sound absorption property of traditional Korean Natural Wallpaper (Hanji). Journal of the Korean Wood Science and Technology. 2018; 46(6):703-712.

6.

Kang C-W., Jang E-S., Jang S-S., Kang H-Y. Comparison of transfer function method and reverberation room method in measuring the sound absorption coefficient of rice straw particle mat. Journal of the Korean Wood Science and Technology. 2018a; 46(4):362-367.

7.

Kang C-W., Jang E-S., Jang S-S., Kang H-Y. Measurement of sound transmission loss in a sound barrier filled with the rice-straw particles by the transfer function and laboratory measurement methods. Journal of the Korean Wood Science and Technology. 2018b; 46(4):338-345.

8.

Kang C-W., Lee N-H., Jang E-S., Jang S-S., Kang H-Y. Sound absorption coefficient and sound transmission loss of rice hull mat. Journal of the Korean Wood Science and Technology. 2019; 47(3):290-298.

9.

Kim C-W., Chang T-C., Kim D-S. Characteristics analysis of highway traffic noise. Transactions of the Korean Society of Noise and Vibration Engineering. 2012; 22(12):1191-1198.

10.

Kim B-R., Lee J-Y. Studies on utilization of bark by carbonization. Journal of the Korean Wood Science and Technology. 2006; 34(1):40-51.

11.

Kook J-H., Jung C-W., Yun J-H., Kim J-S. Experimental study on wall sound transmission loss at construction equipment machinery room. Transactions of the Korean Society of Noise and Vibration Engineering. 2007; 3:695-699.

12.

Lee H-H. Studies on the Physical Properties of Major Tree Bark Grown in Korea - Genus Pinus, Populus and Quercus -. Korean Forest Society. 1977; 33:33-58.

13.

Lee H-H. Studies on the new manufacturing process and physical, mechanical properties of barkboard. Journal of the Korean Wood Science and Technology. 1989; 17(4):26-34.

14.

Lee J-H., Kim B-S., Kim K-J. Study of Sound Transmission Characteristics of using a Scale Reverberation Chamber and vibro acoustic FEM. Transactions of the Korean Society of Noise and Vibration Engineering. 2011; 10:92-95.

15.

Li Y., Li Z., Han F. Air flow resistance and sound absorption behavior of open-celled aluminum foams with spherical cells. Procedia Materials Science. 2014; 4:187-190.

16.

Mun S-P., Kim J-P. Utilization of pine bark (I) - Chemical compositions and characterization of Ca - base acid sulfite cooking of pine bark-. Journal of the Korean Wood Science and Technology. 1994; 22(1):28-33.