1. INTRODUCTION
Plants, a source of cellulose, grow abundantly in Indonesia and significantly contribute to the economic development of the country. Wood consists of cellulose, hemicellulose, lignin, and water-soluble extracts (Yu et al., 2018). The chemical composition of wood depends on the type, maturity and location of growth (Sangian et al., 2015). Scientists have been studying the utilization of lignocellulosic materials as valueadded materials, composites, biofuels, ethanol, sugars, and biogases (Kumar et al., 2018; Widjaja et al., 2015; Andrade et al., 2017).
Pretreatment of the wood source is required prior to the conversion of lignocellulose to decrease the activation energy of lignocellulose in the biochemical reaction and to increase its reaction rate compared with non-pretreated wood (Syaftika and Matsumura, 2018). Investigators have reported that the structure of the biomass is also related to the rate of the chemical reaction of the substrate (Ma et al., 2013). The optimal conditions of the pretreatment technology should demonstrate feasibility, improve efficiency, produce low wastes, be sustainable, meet environmental requirements, and be a safe process.
Researchers have employed chemical, physical, and physical/chemical methods to pretreat lignocellulose. Acids and bases have been used by investigators for years in a lignocellulosic modification process (Badiei et al., 2014). Meanwhile, the physical methods applied have been dominated by sub and supercritical fluids and explosion (Rabemanolontsoa and Saka, 2016; Jung and Yang 2016). The main objective in using these techniques is to break the hydrogen bonds between the fibers and the 1,4 beta glycosidic bonds in the cellulosic materials (Chen et al., 2017). After pretreatment, as previously reported by investigators employing both chemical and physical methods, the substrate is transformed into a more amorphous state, as indicated by the change in the crystallinity parameters.
Another method that has been attracting investigators is the use of ionic liquids for pretreatment since they have superior properties to acidic or alkaline substances. Ionic liquids have low freezing points and low vapor pressures and thus can be easily condensed from the vapor to the liquid phase, and they can be recycled many times after application (Sangian and Widjaja, 2017).
These previously reported methods present many challenges that must be addressed. The use of acid and alkaline substances can be harmful to people and the environment by generating pollution in water and soil (Kim et al., 2016). Although the synthesized ionic liquids are easy to handle, they are expensive and thus not feasible to scale up for industrial applications (Baral and Shah, 2016). Physical pretreatment techniques are rapid, clean processes that utilize less water. However, they are generally conducted at high pressures and temperatures that require expensive valves, piping, and other specialized equipment (Kumar et al., 2018). Thus, research is needed to optimize the pretreatment process using inexpensive, abundant resources in an environmentally safe manner.
This purpose of this work is to utilize saline water to modify the lignocellulose structure. The source of the lignocellulose used in this study was waste champak timber from the traditional home building industry. The lignocellulose was milled to 100 mesh, and 10%, 20%, and 27% saline solutions were prepared. The substrates were then mixed with the saline solutions and maintained for 14 days. The substrates were recovered, washed, and then dried under solar radiation for several days until their masses were constant. All substrates were characterized using X-ray diffraction (XRD), Fourier-transform infrared (FTIR) spectroscopy, and scanning electron microscopy (SEM). The treated biomass structures were compared with untreated samples. The results can be considered for application of the lignocellulosic pretreatment in the production of value-added materials such as reducing sugars, ethanol, biocomposites and bioplastics.
2. MATERIALS and METHODS
Champak timber powder was obtained from the home industry in Tombatu Village, North Sulawesi, Indonesia. Wood particles were screened using a 100-mesh sieve. The salt, a commercial product, was purchased from PT Empat Saudara, Manado, Indonesia. It was dried and then mixed with fresh water. Saline solutions were prepared by adding 100, 200, and 270 g of salt to three aliquots of fresh water to prepare three solutions of 1000 grams of saline water with salt concentrations of 10%, 20%, and 27% (w/w), respectively.
Three 100-gram samples of the native substrates were each mixed with a saline water solution of 10%, 20%, or 27% salt and then stored for 14 days. The solids were subsequently washed using flowing fresh water in a funnel and filter assembly and then recovered. Each substrate was dried under sunlight for several days until its mass was constant. Then, the treated and native substrates were isolated using a plastic bag.
The characterization of all substrates was performed using XRD (X'Pert X-ray Diffractometer, Philips, Almelo, Netherlands), FTIR (IR Prestige 21, Shimadzu, Japan) and SEM (Inspect S50, FEI, Japan) instrumentation at the State University in Malang City, East Java, Indonesia. For the XRD analysis, which was carried out at room temperature (25°C), the initiation angle (2θ) was set at 10.01°, and the completion angle was 89.9°. The voltage difference used was 40 kV, and the electrical current was 35 mA. The K-alpha and K-beta beams were set at 1.54 Å and 1.39 Å, respectively. The FTIR spectrometer was operated from 400 to 4000/cm. For the surface images of the substrate, the SEM applied voltage difference was set to 15 kV, and the magnifications used were 200, 500, 1000, and 5000×. The WD and spot parameters were 10.8 mm and 5.5 mm, respectively.
The crystallinity parameters, such as the crystallinity index (CrI), the lateral order index (LOI), the total crystallinity index (TCI), and the hydrogen bonding intensity (HBI) were measured. Changes in the CrI, LOI, TCI, and HBI values can explain the change in the crystallinity order of the champak timber. If CrI, LOI, and TCI values decreased as the HBI value increased, the crystallinity order of the material decreased, indicating the cellulose I transformed into cellulose II, which is an amorphous structure. CrI was obtained by comparing the 002 peak (I002) and the amorphous intensity (IAM) using the technique employed in a previous study proposed by Park et al. (2010):
The LOI parameter was measured by comparing the absorbance values of the functional chemicals at the wave number of 1446 and 896 cm-1 from the FTIR spectra, using the equation below:
The ratio of the absorbance values at the 1373 and 2900 cm-1 band is TCI and was obtained by the following equation:
The LOI and TCI parameters were proposed by the authors Nelson and O'Connor in 1964, and authors Kruer-Zerhusen et al. (2018) reported that the parameter of HBI is determined by the ratio of the wave numbers at the 3350 and 1337 cm-1 bands as follows:
3. RESULTS and DISCUSSION
Fig. 1 shows the XRD patterns of substrates that were pretreated with salt concentrations of 10%, 20%, and 27%. All graphs have a similar shape but differ in the intensity. The XRD characteristics of the investigated lignocellulose are dominated by three peaks located at approximately 15°-16°, 22°-23°, and 34°-35° and one valley at approximately 17°-18°. The peaks are reflected by the planes and indicated by Miller indices (101), (002), and (040) (French and Cintron, 2012).

The peak of the non-pretreated sample curve is the highest of all of the curves, indicating that the crystal units are regular. The planes of the crystals in the substrate act as reflective mirrors to the incident light. If the mirror has no defects, the light is completely reflected. The XRD plots of the saline water treated substrates show decreased intensity for all three concentrations of saline solution: 10%, 20%, and 27%. This decrease indicates that the crystals were defective and expanded (Karimi and Taherzadeh, 2016). The salt molecules can change the crystal units inside the biomass, resulting in the decrease in intensity. The intensities of both the treated and non-treated substrates are shown in Table 1. The intensity of the native substrate is 135 Cs and follows the 10%, 20%, and 27% salt pretreatment samples recorded at 116, 109, and 113 Cs, respectively. The NaCl in the saline solutions is ionized, becoming Na+ and Cl‒ ions that attach to the wood particles. The ions can break the hydrogen bonds connecting the fibers via an OH group in the polysaccharide chain (Feng and Chen, 2008).
One of the parameters that can indicate a structural change of the solids after pretreatment is CrI (Yue and Qian 2018). Table 1 presents CrI of the substrates after pretreatment with 10%, 20%, and 27% saline solutions and CrI of the native timber for comparison. CrI of the original substrate is 61.43%, which is the highest of all substrates. When the 10% and 20% salt solutions are applied in the pretreatment, CrI declines to 48.90 and 47.85%, respectively. CrI slightly increases to 50.22% when the substrate is treated with 27% salt. The increase may be caused by the contribution of the salt inserted into the substrate.
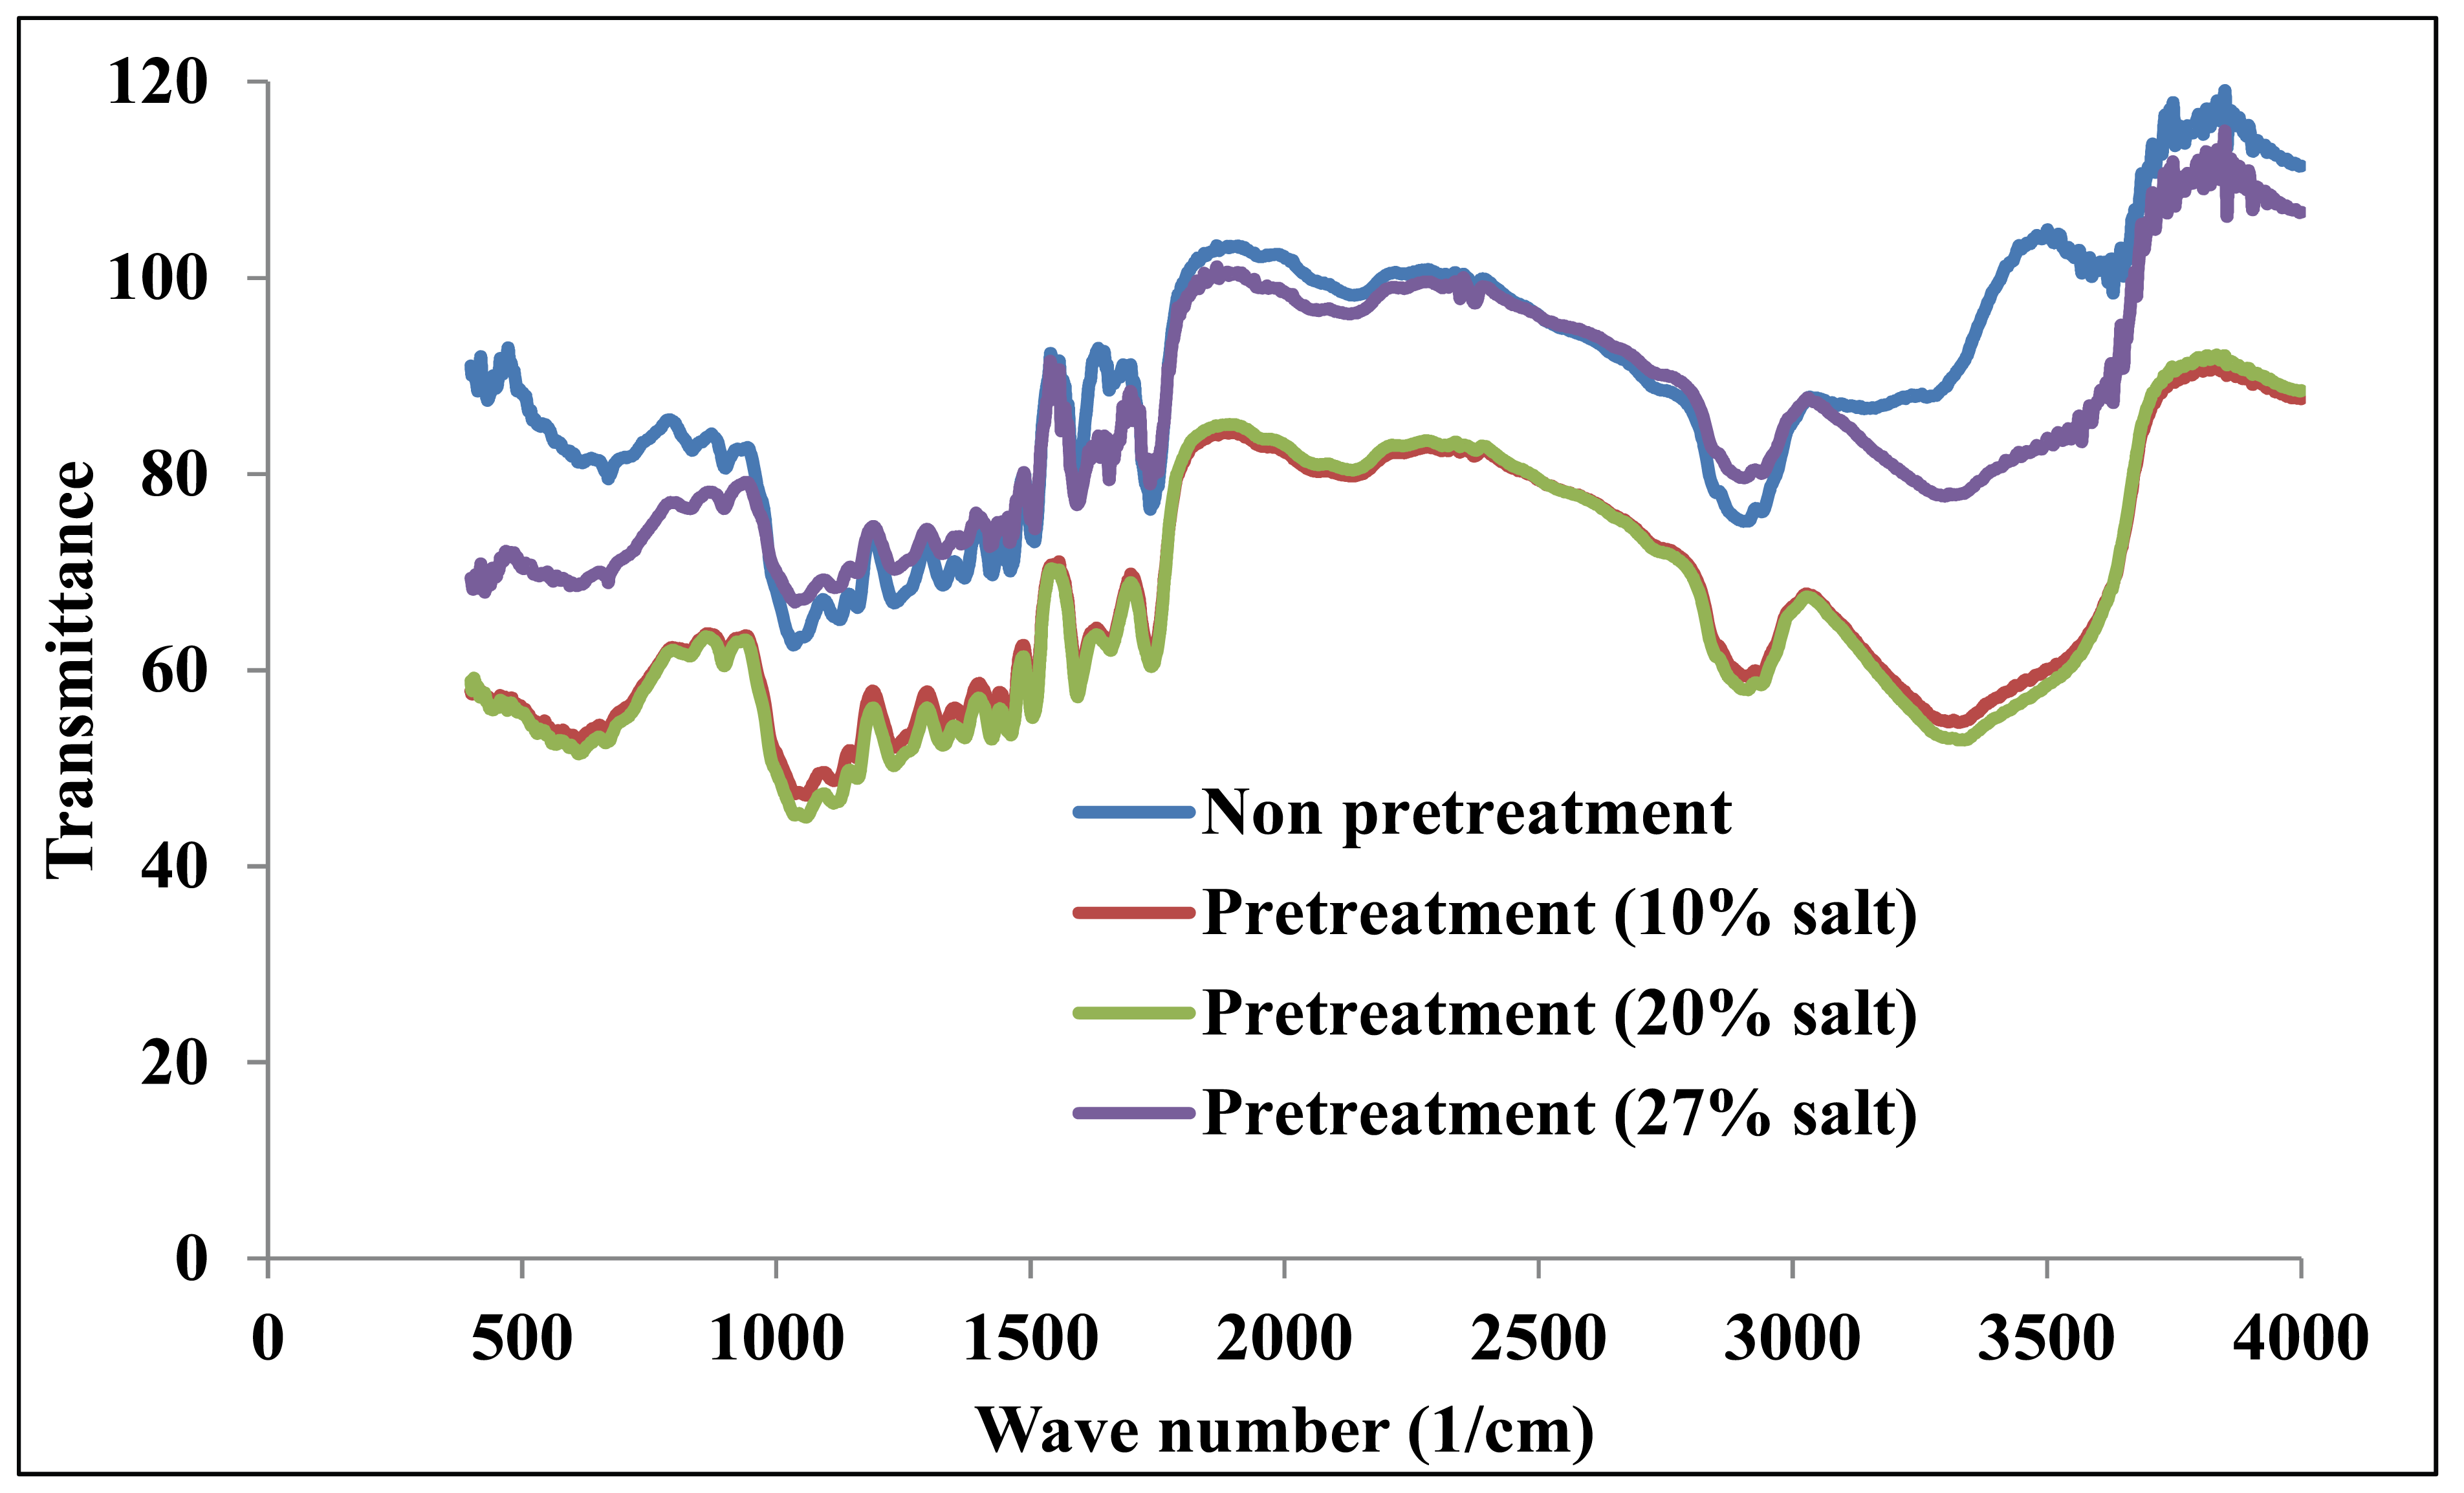
Fig. 2 shows the FTIR spectrum of the original substrate (A), and champak substrates treated with 10% (B), 20% (C), and 27% (D) salt solutions. Fig. 2A (non-pretreatment) shows that the strength of the O-H stretching motion is weak and has a low valley. The function of the O-H bond is to connect the fibers via a hydrogen bond (Widyorini et al., 2018; Iswanto et al., 2018). When the 10%, 20%, and 27% saline solutions were employed for pretreatment, as shown in Figs. 2B, 2C, and 2D, the absorbance valleys were deeper compared with the native substrate. The salt pretreatment caused the peak situated at 3100 cm-1 to become higher and sharper compared with the original substrate. The peak located at 3500 cm-1, as shown in Figs. 2B-2D, almost vanished after the salt pretreatments. This result indicates that salt pretreatment can modify the lignocellulosic material.

Fig. 3 shows the combined FTIR spectra of the original solid and the substrates treated with the 10%, 20%, and 27% salt solutions. This graph clearly shows that the transmittance intensity of the treated substrate changed significantly compared with the non-pretreated sample. The FTIR spectral trend is similar to the XRD graph, as previously mentioned. The transmittances of the substrates treated with 10 and 20% saline solutions decreased significantly due to the changes of the substrate structure, resulting in a more amorphous structure and broken hydrogen bonds via OH groups (Shishir et al., 2011). When the salt concentration was increased to 27%, the transmittance increased and overlapped with the non-pretreated data. This may be attributed to the insertion of the salt substances into the lignocellulose. The changes in the valleys and peaks, as previously described, are very clear in this graph.

To support the claim of structural transformation in the saline treated substrates, the LOI, TCI and HBI parameters were determined. To determine these parameters, the FTIR spectra needed to be changed to the absorbance (A) vs. wave number using Beer's Law, A= 2 ‒ log(%T) (Table 2).
The LOI and TCI parameters were determined to verify the substrate structure and compare the structure to that of the XRD results. The non-pretreated substrate resulted in the LOI and TCI observed at 1.666 and 1.265 cm-1/cm-1, respectively (Table 3). When the substrates were treated with 10% salt, the LOI and TCI declined to 1.229 and 1.147, respectively, which was close to the corresponding 20% salt pretreatment values. This significant decrease was attributed to the alteration of the cellulosic structure to an amorphous form (Poletto et al., 2014).
| Pretreatment | LOI | TCI | HBI |
|---|---|---|---|
| None | 1.666 | 1.265 | 0.195 |
| 10% salt | 1.229 | 1.147 | 0.998 |
| 20% salt | 1.254 | 1.161 | 1.000 |
| 27% salt | 1.151 | 1.353 | 0.784 |
The TCI of the 27% salt pretreatment sample increased to 1.353, and the trend correlated with the crystallinity analyzed in the XRD graph. This increase may be caused by the presence of the salt substances, which were not dissolved in the washing step, and the hydrogen bonds on the OH groups that were broken significantly. The changes in the LOI and TCI parameters confirm that salt pretreatment can alter lignocellulose structure. The transformation of the substrate from high crystallinity to low crystallinity was supported by the HBI data. The HBI of the native substrate was recorded at 0.195 and increased to 0.998 for the 10% salt pretreatment. When the salt concentration was increased to 20%, the HBI slightly improved to 1.000. The significant increase of the HBI can be attributed to the change of the substrates to a more amorphous structure (Kruer-Zerhusen et al., 2018).
The structural transformation of the champak timbers can be seen in their surface morphologies in the SEM images shown in Fig. 4. This work used SEM images with magnifications of 200, 500, 1000, and 5000x, and the latter is presented in this section. The characteristics of the lignocellulosic surface were much more irregular than the pure cellulose obtained from the lignocellulose, which consists of cellulose, hemicellulose, and lignin. The irregular arrangement of the crystals is attributed to the lignin and hemicellulose components, which have amorphous structures (Chandra et al., 2016). The surface morphology of the non-pretreated substrate was smoother than the rest of the substrates (Fig. 4a). The surface appears to have holes and is layered.

Surface morphology substantially changed when the 10% salt solution was employed for the pretreatment, as displayed in Fig. 4b. Initially smooth, the surface was disturbed by the saline pretreatment, which increased the surface area substantially and resulted in a more parallel orientation of the particles compared with the non-pretreated sample. The biomass surface of the 20% salt solution pretreated samples was rougher than the 10%- and non-pretreated samples. The previously mentioned layers were completely torn apart and destroyed (Fig. 4c). The number of holes in the layers increased, and some intersected others; hence, the surface area and porosity was much higher than that of the 10% salt pretreated samples. Increasing the salt concentration to 27% resulted in the continued transformation of the surface to a more amorphous structure. The layers broke into an increasing number of fragments of smaller size, resulting in higher surface areas with a more amorphous structure than the non-pretreated, 10%, and 20% salt solutions. Investigators have reported that amorphous or porous lignocellulose increases the yield of the desired products, such as sugar and ethanol (Jay and Verma, 2016). The salt-treated substrates, which have a low energy of activation and an amorphous form, have lower barriers: the reactants are more easily converted into the products of the chemical reaction (Roman and Winter, 2004). The lower energy of activation of the substrate causes a faster rate of the chemical reaction.
The use of saline water is currently an option for biomass pretreatment. This work shows that saline water can change the lignocellulose structure and is comparable with expensive chemical substances, such as synthesized ionic liquids, alkaline substances, and acids, that also may be dangerous to humans and the environment. The use of saline water, however, does have a disadvantage: the pretreatment requires a long time period, while the use of synthesized substances requires a short time period.
4. CONCLUSION
-
Saline water was employed successfully for the pretreatment and transformation of lignocellulose substrate structures. The XRD intensities of the treated substrates decreased significantly compared with the non-pretreated samples. CrI parameters of the substrates treated by 10%, 20%, and 27% salt solutions were 48.90, 47.85, and 50.22%, respectively, compared with the original timber recorded at 61.43%. The distributions of the XRD data of the treated timbers were nearly below the line I=1, indicating a change in the substrate's crystallinity.
-
The FTIR spectra show significant changes in the valleys and peaks of the treated substrates. The peak situated at 3500 cm-1 is nearly completely diminished, and the valley located at 3300 cm-1 is sharply formed.
-
The LOI, TCI, and HBI of the treated substrates changed compared with the non-pretreated substrates and the surface morphologies of treated substrates were more amorphous, as indicated by the decrease in particle size.
