


1. INTRODUCTION
Noise pollution is a growing concern for households in urban areas as it significantly reduces the overall quality of life. Currently, the construction industry uses sound-absorbing materials to minimize environmental noise. Since the 1970s, synthetic materials have gained widespread use in sound absorption applications owing to their affordability and effectiveness (Ravandi et al., 2015). However, these synthetic materials pose potential health risks because they often contain volatile organic compounds, which can contribute to issues such as sick-building syndrome (Shao et al., 2023).
In response to growing concerns regarding global warming, recent research has focused on employing natural materials to increase sustainability in the construction industry. These materials offer a crucial advantage owing to their abundant availability and contribute to addressing waste management challenges. The construction sector has increasingly adopted innovative sustainable materials to fulfill sound-absorption requirements.
Natural sound-absorbing materials have been replacing synthetic materials in building applications. Various natural materials, including coconut fibers (Cao et al., 2018), kenaf fibers (Lim et al., 2018; Taban et al., 2020), pine pollen cones (Jang, 2022b), and others (Borrell et al., 2020; Buratti et al., 2018; Hwang and Oh, 2020; Jang, 2022c, 2023) present potential applications in acoustic solutions. Natural materials are highly desirable for sound absorption because of their low toxicity, safety for human use, and biodegradability, reducing the environmental impact and promote sustainability.
This study examined the sound absorption performance of water hyacinth, with the aim of utilizing this natural material. The decision to explore water hyacinths is driven by their abundance and rapid growth, which leads to environmental challenges. Water hyacinths, known for their swift proliferation, cause invasion and congestion in rivers and lakes. It takes approximately 50 d for water hyacinths to reach a plant density of 10 kg/m2 under constant temperature and nutrient conditions (Wilson et al., 2000). These invasions create masses of floating plant material and disrupt ecosystems. In 2023, the Department of Public Works and Town and Country Planning of Thailand, Ministry of the Interior, found an accumulation of water hyacinth in 33 provinces, totaling over 650,000 tons.
Previous studies have suggested that the water hyacinth is a potential alternative to sound absorbers. For example, particles from water hyacinth stalks mixed with gypsum achieved higher sound absorption coefficients than those from gypsum composites (Marín et al., 2023). Water hyacinth biochar blended with polyvinyl alcohol has been used as a composite sound-absorbing material (Wibawa et al., 2023). However, further research is needed on the use of dried water hyacinth as a sound-absorbing material. This study used unprocessed dried water hyacinth as an environmentally friendly material that conserves energy during processing. In addition, the lack of a comprehensive exploration of its performance under varying parameters remains of significant interest. This study aimed to comprehensively investigate and address this gap by providing a detailed understanding of the issue.
This study focuses on transforming water hyacinths from the Chao Phraya River in Thailand into materials for sound absorption. The main objective of this study was to determine the most suitable conditions for using water hyacinth to create effective sound-absorbing materials. In doing so, this study explored the impact of varying thicknesses and air-gap depths on the sound absorption coefficients. Furthermore, we examined the noise reduction coefficient (NRC) values of the water hyacinths.
2. MATERIALS and METHODS
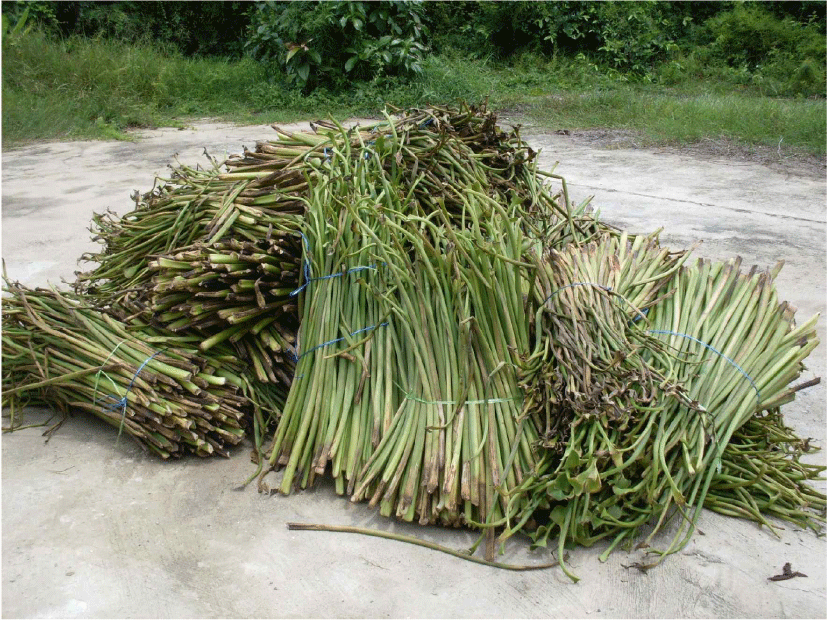
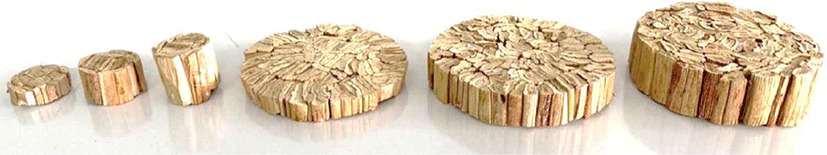
Water hyacinths were collected from the Chao Phraya River around the Rajamangala University of Technology, Phra Nakhon, Thailand. Water hyacinths are shown in Fig. 1. The roots and leaves of hyacinths were discarded, and stalks with 15–20 mm diameter were used in this study. Water hyacinth stalks were separated and washed with water to remove any impurities. The washed stalks were cut to 200 mm in length and dried in the sun for seven days. The moisture content was measured according to ASTM D4442, which had a relative humidity of approximately 7%. The dried stalks were arranged on waxed paper. Polyvinyl alcohol adhesive was sprayed on the surface of each dried stalk to adhere them together, using the minimum volume of adhesive to minimize its effect on the results. The dried stalks with the adhesive were rolled and wrapped in paper before being inserted into PVC tube molds with 30 and 100-mm diameters. The samples were suspended in the air for 72 h to ensure that the adhesive had dried and that each stalk adhered together. The samples were then removed from the tube, and the wrapping papers were peeled off. The specimens were cut into 10, 20, and 30 mm cross-sections thicknesses for testing. The test specimens are shown in Fig. 2. The specimens were weighed, and their cross-sectional morphology was investigated using a digital microscope at a magnification of 5X.
Sound absorption coefficients were determined according to ISO 10534-2 procedure. Fig. 3 shows a schematic of the equipment setup. The equipment set included impedance tubes with consistent circular cross-sections manufactured by BSWA Technology (Beijing, China). Specifically, measurements were conducted using SW422 and SW477 impedance tubes with 30 mm and 100 mm diameters, respectively.
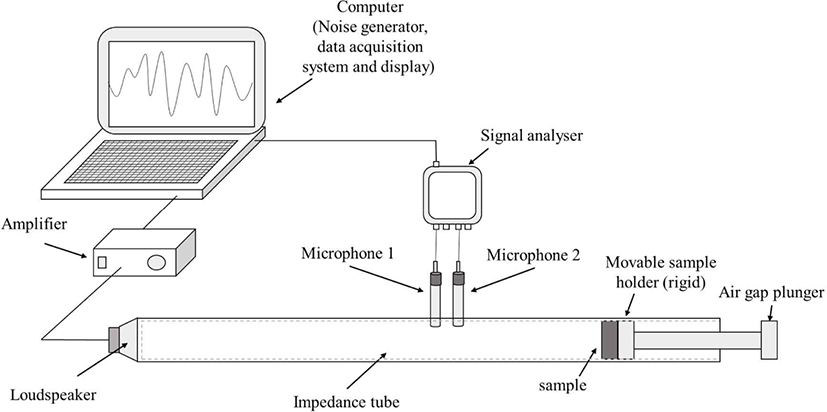
Each specimen was positioned at one end of the tube. A loudspeaker emits noise to maintain stable sound energy across a constant bandwidth per Hz. The specimen was positioned with its surface perpendicular to the incoming sound waves, while a 4-inch diameter loudspeaker (20 W, 4 Ohms) was placed at the opposite end of the impedance tube. White noise generated by the computer was transmitted to the tube via the loudspeaker. To stabilize the temperature inside the tube, the loudspeaker was operated for 10 min before the measurements were taken. Two microphones strategically placed in front of the specimen recorded the incident and reflected sounds. Two 1/4-inch Class 1 microphones were positioned between the specimen and loudspeaker, featuring a frequency range of 20–20,000 Hz, along with a 50 W Class D power amplifier to record the sound pressure within the impedance tube. The sound calibrator was set at 114 dB at 1 kHz.
The recorded signals were used to calculate essential auto- and cross-spectral components. A computer connected to a data-acquisition device captured the sound signals. VA-Lab4 Basic and VA-Lab4 IMP-AT software were used to process these signals and calculate the transfer function between the two microphones, enabling the determination of the sound absorption coefficient as a function of frequency. In this experiment, the valid frequency range determined by the diameter of the impedance tube was 63–6,300 Hz. High-frequency measurements (800–6,300 Hz) were taken using a 30 mm diameter tube, whereas low-frequency measurements (63–1,800 Hz) were conducted with a 100 mm diameter tube.
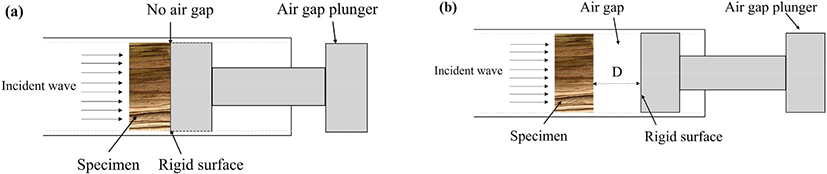
The impedance tube was equipped with a movable air-gap plunger, which allowed for the adjustment of air-gap depth behind the specimen. The specimen was positioned within the impedance tube under two conditions: one with no air gap, and the other with a specified air-gap depth between the rigid surfaces. The illustration in Fig. 4(a) shows the absence of an air-gap depth, and Fig. 4(b) shows an illustration of the air-gap depth.
The measurement data for the specimens were collected considering various thicknesses (t) and air-gap depths (D) behind the specimen. The sound absorption coefficient (α) range was 0 to 1. These tests were conducted under conditions of 53% relative humidity and 22.5°C. The results for each specimen were analyzed using three repetitive tests to ensure repeatability and reproducibility.
The NRC value, a standardized rating widely applied in commercial products, is a crucial metric for evaluating the sound absorption effectiveness, which is typically associated with human conversation. The NRC values were derived by averaging the sound absorption coefficients at 250, 500, 1,000, and 2,000 Hz. Many researchers have measured sound absorption coefficients to determine the NRC values of natural materials (Gokulkumar et al., 2020; Jang, 2022d; Jang and Kang, 2021).
3. RESULTS and DISCUSSION
The average weights and bulk densities of the samples are listed in Table 1. Differences in bulk densities among certain specimens can be attributed to factors such as the size, quantity, and surface characteristics of the stalks and the arrangement in which the stalks are closely packed together. Moreover, the results indicate that the variation in density is within an acceptable error range of approximately ± 5%. This range was considered acceptable and had no significant influence on the sound absorption values.
Fig. 5 shows the cross-sectional morphology of the specimen. Water hyacinth stalks tend to adhere to each other. The morphology displays numerous pores on the stalks and a rough surface. Furthermore, the cross-sectional morphologies of all specimens exhibited similar characteristics.
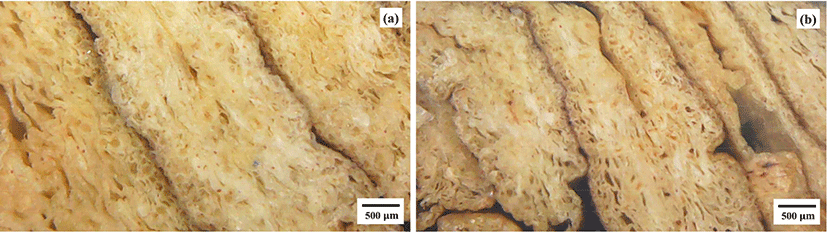
In Fig. 5(a), a depiction of the morphology of the specimen with 10 mm thickness and 30 mm diameter demonstrates that the arrangement between the stalks is closely packed, indicating a higher bulk density of the specimens. Additionally, in Fig. 5(b), representing the morphology of the specimens with 30 mm thickness and diameter, there are small gaps between the stalks, reflecting a lower bulk density of the specimens. The variation in surface characteristics of water hyacinth stalks is evident and contributes to the observed closely packed arrangement. This variability plays a role in influencing the bulk density.
Figs. 6 and 7 show the sound absorption coefficients at 125–4,000 Hz. Fig. 6 shows the comparative results for specimens with thicknesses of 10, 20, and 30 mm without an air-gap depth. The results indicate that increasing the thickness significantly increases the values.
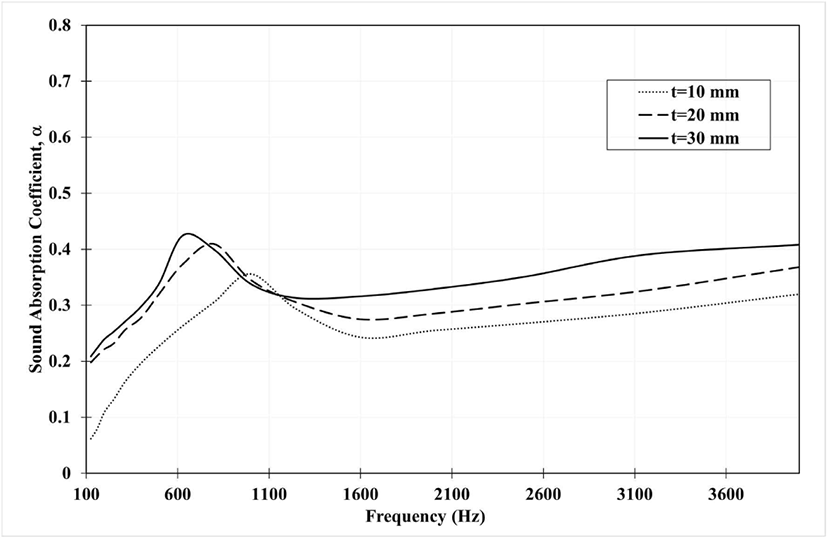
These results were consistent with those of previous studies (Jang, 2022a; Lim et al., 2018; Malawade and Jadhav, 2019). Increasing the thickness improves the wave absorption and reduces the energy reflection. Consequently, waves have long wavelengths at low frequencies, making thicker materials more effective for absorption. The results indicated that a greater thickness leads to better sound absorption, which is attributed to the longer wavelengths involved (Adnan and Rus, 2013; Hassan and Rus, 2013).
The results for the specimens with a thickness of 30 mm showed a maximum peak at 630 Hz with a value of 0.43. The results for specimens with 10 mm thickness consistently exhibit an excellent sound absorption coefficient, with α > 0.3 at 700 to 1,200 Hz. Also, the sound absorption coefficients for specimens with 20 and 30 mm thicknesses are significant, with α > 0.3 at 500 to 1,200 Hz.
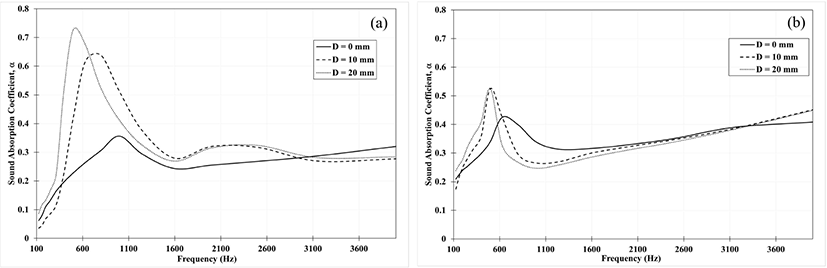
In Fig. 7, the 10 mm thick specimen, featuring 10- and 20-mm air gap depths, exhibits excellent sound absorption coefficients, α > 0.3 at 250–1,200 Hz. Similarly, the 30 mm thickness and 10 and 20 mm air gap depths demonstrate excellent sound absorption coefficients, α > 0.3 at 250–1,500 Hz. The findings revealed a peak sound absorption coefficient of 0.73 at 500 Hz for the specimen with a 10 mm thickness and a 20 mm air-gap depth.
In various studies (Prabowo et al., 2019; Seddeq, 2009; Soltani and Zarrebini, 2013), similar findings were observed when employing the well-established technique of increasing the air-gap depth for sound absorption performance. Fig. 7 demonstrates that the highest frequency shifts towards a lower frequency as the air-gap depth increases. The results were precise, showing an evident shift in the peak frequency toward lower values, while the airgap depth increased because of the Helmholtz resonance effect. This shift occurred because the increased air-gap depth induced sound resonance within the gap. Larger volumes of air gaps allow longer-wavelength waves to resonate, resulting in a more significant energy loss (Han et al., 2003; Komkin et al., 2017).
Moreover, this conclusion indicates that the air-gap depth increases, resulting in higher sound absorption coefficients than when there is no air-gap depth. Considering the cost-saving aspects of materials, substituting a portion of the water hyacinth with an air gap depth has emerged as a potentially more economical solution.
Table 2 illustrates that increasing the thickness from 10 to 20 mm resulted in an increase in the sound absorption coefficient at 250, 500, and 2,000 Hz, with similar values at 1,000 Hz. This led to a 1.2-foldincrease in the NRC value.
| Thickness (mm) | Sound absorption coefficient at frequency (Hz) | NRC | |||
|---|---|---|---|---|---|
| 250 | 500 | 1,000 | 2,000 | ||
| 10 | 0.13 | 0.23 | 0.36 | 0.26 | 0.24 |
| 20 | 0.23 | 0.32 | 0.36 | 0.29 | 0.30 |
| 30 | 0.25 | 0.34 | 0.38 | 0.33 | 0.32 |
The sound absorption coefficients increased at all frequencies when the specimen thickness increased from 10 mm to 30 mm, resulting in a 1.3-fold increase in the NRC value. These findings indicated that the NRC values of the specimens increased significantly with increasing thickness, which is consistent with the results of other studies (Husain et al., 2019; Jang, 2022b).
Table 3 summarizes the NRC values for test specimens with larger air-gap depths. The NRC values range from 0.24 to 0.41. The highest NRC value observed was 0.41, which was noted in specimens with 30 mm thickness and 10 mm air-gap depth. Comparing the specimens, the NRC values of specimens with 10 mm thickness exhibited an increase in air gap depths.
Fig. 8 compares the NRC values of water hyacinth with those of natural materials from previous studies, all at a thickness of 30 mm. The NRC values of water hyacinths were close to the NRC values of hemp (Berardi and Iannace, 2015) and cork (Berardi and Iannace, 2015). However, the NRC values of water hyacinth were lower than those of chemically treated and untreated herbal waste (Kolya and Kang, 2024). Conversely, the NRC values of water hyacinth are higher than those of peanut shells (Jang, 2022a), Malas wood (Kang et al., 2018), and wood (Berardi and Iannace, 2015).
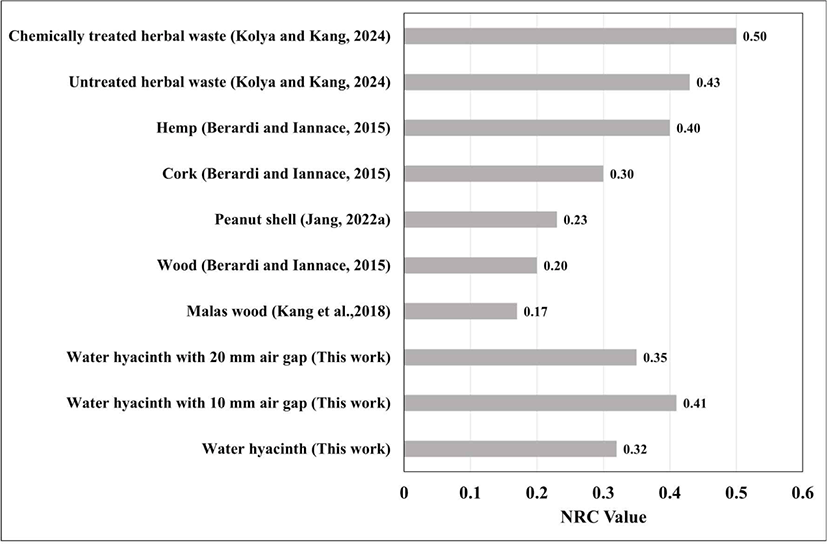
Therefore, the NRC values obtained for water hyacinth provide valuable data for its potential application as a sustainable and environmentally friendly sound-absorbing material.
4. CONCLUSIONS
This study proposes water hyacinth as a sustainable solution for improving sound absorption performance. These results suggest that increasing both the thickness and air-gap depth significantly improves sound absorption performance.
Despite improvements in the air-gap depths, comparable outcomes were achieved, indicating a sustainable and economical approach. Additionally, increased thickness and larger airgap depths were associated with higher NRC values. This study provides valuable insights for designing acoustic materials with improved performance, contributing to sustainable and economic considerations, and adding aesthetic value.
A limitation of this study is the use of an impedance tube, which evaluates the sound absorption performance only for the vertical incident sound. Therefore, it is essential to conduct further evaluations using the reverberation chamber method. Moreover, future research should explore the potential of water hyacinths as acoustic materials, focusing on characterizing the samples to gain insights into their mechanical and thermal properties.