


1. INTRODUCTION
The global trend toward consuming natural products with bioactive ingredients from botanical sources has recently increased (Huh et al., 2022). These natural bioactive materials offer health benefits through cellular or physiological activities (Lu et al., 2021) and have lower toxic and/or mutagenic effects than synthetic compounds (Nam et al., 2018). Among these, phenolic compounds are highly valued for health benefits due to their antioxidant, antimicrobial, anti-inflammatory, and hypoglycemic properties (Nirmal et al., 2015). These secondary metabolites, synthesized during plant growth or in response to environmental threats (Ballesteros et al., 2017), are crucial in promoting health by providing cellular or physiological benefits. Some parts of the plant can be phenolic sources such as leaves (Lee and Chang, 2020; Shinn et al., 2019), fruit, and peels (Mahdi et al., 2020; Papoutsis et al., 2018; Yang et al., 2022), root (do Carmo et al., 2018) and wood (Jung et al., 2017; Lee et al., 2020; Nam et al., 2018; Um et al., 2020; Vij et al., 2023).
Sappan wood (Caesalpinia sappan L.), a member of the Leguminosae family, is particularly rich in protosappanin, sappan chalcone, and the most notable, brazilin (Sakti et al., 2019). Traditionally utilized in medicine, food, and beverage industries, sappan heartwood is especially prized for its extensive phenolic content. However, these phenolic compounds are highly susceptible to degradation (Ballesteros et al., 2017; Nguyen et al., 2021) by light, moisture, and oxygen, accelerating oxidation and diminishing their health benefits.
Microencapsulation offers a promising solution to protect these sensitive bioactive components during storage and application (Chaumun et al., 2020). This method involves entrapping the active substances within a stable wall matrix, enhancing product stability, extending shelflife, and controlling the release (Souza et al., 2018). Several microencapsulation techniques have been known, such as spray drying, extrusion, freeze drying, spray cooling, ionic gelation and thermal gelation (Lu et al., 2021).
Spray drying, a widely used microencapsulation technique, provides numerous advantages, including low cost, ease of operation, scalability, and product stability (Chaumun et al., 2020; Souza et al., 2018). Moreover, it is also suitable for heat-sensitive components such as phenolic since the inlet temperature is usually low (below 200°C) and has a very short droplet retention time (Lu et al., 2021). During spray drying, water is rapidly removed through heat contact, and the active component is encapsulated in the wall matrix (Machado et al., 2022). This technique has encapsulated various phenolic-rich extracts from spent coffee grounds (Ballesteros et al., 2017), lycopene-rich tomato concentrate (Souza et al., 2018), beetroot (do Carmo et al., 2018), and anthocyanin-rich red cabbage (Machado et al., 2022).
Spent coffee grounds were encapsulated using spray drying with maltodextrin (MD) and gum arabic (GA) as wall materials. The drying air inlet temperature was 100°C with a feed flow rate of 1.8 mL/min. Microcapsules produced contained phenolic between 33.59% to 58.48% from the phenolic content of the extract with a combination of MD-GA (1:1) gave the highest value. These wall materials gave almost the same morphology as the microcapsules, a spherical form with some dehydrated aspect (Ballesteros et al., 2017). Lycopene-rich tomato concentrate was encapsulated using spray drying that operated at inlet and outlet air temperature of 160°C and 80°C, respectively, a feed flow rate of 34 mL/min using MD, whey protein isolate, and modified starch (MS) as wall materials. The microcapsules produced had moisture content between 1.45%–4% and lost their lycopene content between 59%–72% during drying (Souza et al., 2018). do Carmo et al. (2018) microencapsulated beetroot extract using spray drying with MD, inulin, and whey protein isolate as wall materials. The inlet air temperature was 150°C with a feed flow rate of 13.33 mL/min. Microcapsules produced had moisture content below 5% (3.33%–4.24%), high betalain retention (88.6%–95.69%), and inulin:whey protein blend gave good stability. Red cabbage containing high anthocyanin had been encapsulated using spray drying at an inlet temperature of 130°C with a feed flow rate of 8 mL/min. Wall materials used are MD and GA. This process yielded a yield of 44.07%–67.07% microencapsulation and moisture content between 6.25% to 16.38% (Machado et al., 2022).
The choice of wall materials in microencapsulation is crucial as it impacts the final product’s quality. The wall material must be compatible with the active component, capable of forming a cohesive film with the core and producing stable particles (Chaumun et al., 2020). Carbohydrates are among the most commonly used wall materials due to their abundance, low cost, biodegradability, and biocompatibility (Ribeiro et al., 2020). MD, MS, and GA are common carbohydrate-based wall materials. GA is particularly effective due to its excellent film-forming capability, stable emulsion properties, protective colloid characteristics, and plasticity that prevents microcapsule cracking (Krishnan et al., 2005; Machado et al., 2022; Ribeiro et al., 2020). However, its limited supply and high cost restrict its use, prompting the search for alternatives.
MD, derived from the partial hydrolysis of starch, is a low-cost material with oxidation prevention capabilities, but it has poor emulsifying capacity and low retention of volatiles (Ribeiro et al., 2020; Souza et al., 2018). MS, functionally similar to GA, offers good emulsifying properties and high volatile retention. However, it may have an undesirable taste and the disadvantage of being labeled “unnatural” (Ribeiro et al., 2020). Various studies have used combinations of these three wall materials for microencapsulation, including applications in vitamin A, cardamom and turmeric oleoresin, and fingered citron extract encapsulation (Cano-Higuita et al., 2015a; Krishnan et al., 2005; Mahdi et al., 2020; Ribeiro et al., 2020).
Microencapsulation has been identified as an effective method for controlling active compound release, making the study of release kinetics critical. Kinetic modeling plays a significant role in system design by enabling predictable behavior (Baltrusch et al., 2022). Several models are commonly used to predict the release profiles of microcapsules, including zero-order, first-order, Higuchi, Korsmeyer-Peppas, and Weibull models.
Despite the potential benefits, there is limited research on the microencapsulation of sappan wood extract using these carbohydrate-based wall materials. For instance, sappan wood extract was encapsulated with a combination of melamine-urea formaldehyde as the wall material for its dye function (Phanyawong et al., 2018). Another study combined MD and carrageenan to encapsulate sappan wood extract via freeze-drying (Musdalifa et al., 2021). Until now, there have been no reports on using MD, GA, and MS to microencapsulate sappan wood extract. Therefore, this study investigates the effects of different wall materials (MD, GA, and MS) on the characteristics of microencapsulated sappan wood extract produced by spray drying. The research focuses on determining the optimal wall material combination for enhancing encapsulation efficiency (EE), product yield, and controlled release of phenolic compounds, thus providing valuable insights for applying microencapsulation technology to preserve the bioactive properties of natural extracts.
2. MATERIALS and METHODS
Seven-year-old sappan heartwood was sourced from Ungaran, Central Java, Indonesia, community plant. Ethanol was procured from PT Bratachem, Indonesia, and aquadest were purchased from UD Mitra Karya, Indonesia. Three wall materials used for microencapsulation were maltodextrin DE 10-12 (Lihua Starch, Qinhuangdao, China), modified tapioca starch (Kreation SMS, Pathum Thani, Thailand), and GA (Tic Gums, Belcamp, MD, USA). Analytical grade chemicals for analysis were ethanol, methanol, acetic acid, sodium carbonate (Merck, Darmstadt, Germany), Folin-Ciocalteau reagent, and gallic acid (Sigma Aldrich, St. Louis, MO, USA).
The experiment investigated the effects of different wall materials (single wall, binary or ternary blends) on the characteristics of the microcapsules produced. The wall materials used were MD, MS, and GA, individually and in various combinations. The total concentration of wall materials was maintained at 15% (w/v), and the extract amount was 5% (w/w) of the total wall materials. The experiment design is presented in Table 1, ensuring each combination was tested with appropriate controls to ensure the validity of results.
| Run | Maltodextrin (MD; %) | Modified starch (MS; %) | Gum arabic (GA; %) |
|---|---|---|---|
| 1 | 100 | 0 | 0 |
| 2 | 0 | 100 | 0 |
| 3 | 0 | 0 | 100 |
| 4 | 50 | 50 | 0 |
| 5 | 50 | 0 | 50 |
| 6 | 0 | 50 | 50 |
| 7 | 33.33 | 33.33 | 33.33 |
Extraction is the first step for taking bioactive compounds from plants. Ultrasound-Assisted Extraction (UAE) is considered a better extraction method than the conventional ones due to its rapid extraction time and high efficiency (Um et al., 2020). Sappan wood was crushed and sieved to pass through a 20-mesh-screen. UAE was performed using a probe type of extractor (Ultrasonic Cell Disruptor TUE-500 with frequency 20–30 kHz) with 60% ethanol as the solvent. A water-ethanol mixture is a better solvent for extracting phenolic compounds than a single solvent (Jung et al., 2017). The extraction was carried out for 30 minutes at 60°C with a solute-to-solvent ratio of 1:20. Post extraction, the solution was filtered using a vacuum filter, and the extract was separated from the solvent using a rotary evaporator (Hei-VAP Advantage, Heidolph, Nuremberg, Germany). The extract was stored in a dark bottle at 4°C until further use.
The solution was fed into a spray dryer (mini spray dryer B-290, BÜCHI, Sankt Gallen, Switzerland) with a standard 0.5 mm nozzle. The only difference was in wall composition; the extract concentration remained cosntant. The spray drying process was conducted with an inlet and outlet spray drying temperature of 150°C and 87°C, respectively, aspiration 90% and pump 25%. The choice of spray drying inlet temperature was based on several studies on phenolic microencapsulation between the temperature range of 80°C–200°C with 150°C being the most used temperature (Lu et al., 2021). Based on the composition specified in Table 1, wall material was mixed with water using a homogenizer at speed of 3,000 rpm for 5 minutes. The extract was then added to the solution, and mixing process continued using homogenizer at 5,000 rpm for 10 minutes. The solution was fed to the nozzle of the spray dryer with a feed flow rate of 4 mL/min, and the powder was collected from the bottom part of spray dryer chamber. The resulting powders were collected from the bottom of the spray drying chamber, sealed in flasks covered with aluminum foil, and stored at 4°C before analysis.
The yield was calculated as the ratio of the mass of powder obtained to the total mass added in the feed using Equation (1):
Bulk density was measured by putting 2 g of microparticles in a 10 mL glass cylinder. It was calculated using Equation (2):
Moisture content (Krishnaiah et al., 2012) was determined gravimetrically by microparticles in an oven at 105°C until a constant weight was achieved. It was calculated using Equation (3):
EE was calculated based on the phenolic content not washed away by solvent (Baltrusch et al., 2022), using Equation (4):
Phenolic retention (PR) was calculated by comparing the phenolic content of microcapsules with the phenolic content of the extract [Equation (5)].
Phenolic retention (PR) =
The microcapsules’ total phenolics and surface phenolics were calculated based on Baltrusch et al. (2022) with slight modification on the centrifugation speed. Total phenolics were counted by mixing 100 mg microparticle with a solution of methanol, acetic acid, and water (50:8:42 v/v/v). The solution was vortexed for 1 minute and ultrasonicated for 20 minutes. The supernatant was centrifuged (6,000 rpm, 10 minutes) and filtered. The phenolic content of the solution was analyzed using UV-Vis spectrophotometer (Genesis 10S). Surface phenolic was calculated by mixing 100 mg sample with 1 mL ethanol:methanol (1:1), stirred for 1 minute and filtered. The phenolic content of the supernatant was then analyzed using UV-Vis spectrophotometer. The extract’s total phenolic content was analyzed using Folin-Ciocalteau’s method (Arsiningtyas, 2021). One hundreds miligrams of extract were added with methanol until 10 mL. A solution of Folin-Ciocalteau’s reagent and 20% sodium carbonat was added. The mixture was incubated for 2 hr, and absorbance was analyzed using a UV-Vis spectrophotometer at 765 nm, with gallic acid used as the standard.
A PSA (Laser Particle Sizer LLPA-C10, Labtron, Camberley, UK) determined particle size distribution. The result showed the particle size and distribution of each size. The mean diameter was also measured, and the distribution sizes of particles (span number) were calculated using Equation (6). The morphology of microparticles was analyzed using scanning electron microscopy (SEM JEOL Type JSM 6510 LA, JEOL, Tokyo, Japan).
Where d10, d50, and d90 are volume diameter at 10%, 50%, and 90% of cumulative volume, respectively (Fernandes et al., 2014).
Release kinetics were studied by dissolving microcapsules in phosphate buffer solution (pH 6.8) and measuring their phenolic concentration at various intervals (0–90 minutes) using a spectrophotometer (refer to point 2.5.4). Gallic acid was used as the standard. For equilibrium concentration (Ce), microcapsules were dissolved in the same solution for 3 hr, assuming that active components were completely dissolved within 3 hr. Release percentage was then calculated using Equation (7):
Where Ct (mg GAE/g extract) is the phenolic concentration at time t, and Ce (mg GAE/g extract) is the phenolic concentration at equilibrium (3 hours).
The data obtained were fitted to approximately five models: zero order, first order, Higuchi, Korsmeyer-Peppas, and Weibull (Table 2; Baltrusch et al., 2022). The percent release of each time was input in each model, and the constants were determined by trial and error to get the lowest Sum of Square Error between actual and calculated data. Hence, the R2 also can be determined. Except for viscosity, yield determination and average particle diameter, the data were mentioned in mean and SD. Statistical significance was measured using Duncan’s test at a significance level of p = 0.05.
| Model | Equation | Constants |
|---|---|---|
| Zero order | k 0 | |
| First order | k 1 | |
| Higuchi | kh | |
| Korsmeyyer-Peppas | kKP, n | |
| Weibull | β, α |
3. RESULTS and DISCUSSION
Product yield refers to the amount of powder recovered after the microencapsulation process. This parameter indicates the resulting powder relative to the initial total wall materials and extract added. The encapsulation yield is influenced by the operating parameters of the spray drying process, such as air inlet temperature and the viscosity of the feed (Lucas et al., 2020; Ribeiro et al., 2020). The type of wall material used can also affect microencapsulation yield (Mahdi et al., 2020).
The study showed that the yield of microencapsulation of sappan extract by using spray-drying ranged from 43.84% to 69.62% (Table 3). The yield is lower than the yield from microencapsulating finger citron extract using GA, MD, MS, and whey protein, which ranged from 77.77% to 89.39% (Mahdi et al., 2020). The operational conditions for its spray drying were inlet and outlet temperatures of 185°C and 80°C, respectively, and a feed flow rate of 17–21 mL/min. However, this yield is higher than that of microencapsulating vitamin A using spray drying with an inlet temperature of 150°C and feed flow rate of 4 mL/min with GA, MD, and MS as wall materials, which ranged from 7% to 39% (Ribeiro et al., 2020). Microencapsulation of turmeric oleoresin using spray drying with an inlet temperature of 170°C and feed flow rate of 3.9 mL/min and MD, GA and MS as wall materials also only achieved a yield range of 24%–58% (Cano-Higuita et al., 2015b). The yield range of microencapsulation of tea extract using carrageenan, MS, and alginate was 38.03%–58.57%, using spray drying inlet temperature of 115°C and feed flow rate of 4 mL/min (Baltrusch et al., 2022). A product yield of around 50% is considered appropriate for laboratory-scale spray drying (Cano-Higuita et al., 2015b).
The low product yield observed in some cases above can be attributed to the production of fine particles, which may lead to losses from the equipment or the adherence of the powder to the drying chamber walls (Chaumun et al., 2020; Ribeiro et al., 2020). This research obtained the highest yield (69.62%) with 100% GA, while the lowest yield (43.84%) was with 100% MS. GA is known for its good film-forming properties, which result in high-yield microcapsules (Karrar et al., 2021; Mahdi et al., 2020). Table 3 also shows that microcapsules containing GA, either alone or in blends, have higher yields than those without GA. This finding is consistent with Mahdi et al. (2020) and Karrar et al. (2021), who also reported higher product yields when the wall material included GA.
The bulk density of sappan extract microcapsules ranged from 0.358 g/mL to 0.583 g/mL (Table 3). Bulk density is a crucial powder property that affects its flowability, storage, and transportation requirements (Korma et al., 2019). This result is comparable to the findings of Alvarenga Botrel et al. (2012), who reported the bulk density of spray-dried microcapsules of oregano essential oil using GA, MD, and MS ranged from 0.34 g/mL to 0.45 g/mL.
A higher bulk density is advantageous as it requires less packing volume and reduces storage costs (Böger et al., 2021; Fernandes et al., 2014). Additionally, higher-density powders contain less air, which decreases the oxidation process (Hee et al., 2015). MS as a wall material resulted in higher bulk density than MD and GA. This is because MS still contains amylose and amylopectin, contributing to its higher molecular weight than MD. Furthermore, MS can form a denser matrix than MD (Jin et al., 2017).
Moisture content refers to the amount of water remaining in microcapsules after the spray drying. This parameter can significantly influence the crystallization behavior and glass transition, thereby affecting the stability and storage period of the powder. Additionally, moisture content correlates with flowability, stickiness, and microbial growth (Mahdi et al., 2020). Microcapsules with high moisture content are prone to stickiness and may release their active compounds during storage (Lee and Chang, 2020).
In this study, the moisture content range of sappan extract microcapsules is 2.8%–5.6%. Microcapsules made with MS gave the highest moisture content, indicating its tendency to retain water during spray drying. The moisture content of these microcapsules is comparable to that of tamarillo powder encapsulated with MD, GA and octenyl succinic acid-MS, with moisture content ranging from 3.43% to 4.89% (Ramakrishnan et al., 2018) and fingered citron encapsulated with GA, MD, MS, and whey protein with moisture content range of 4.5% to 5.7% (Mahdi et al., 2020). Machado et al. (2022) encapsulated anthocyanins from red cabbage using MD, GA, and citric acid and obtained moisture content range of 6.25%–16.42%, higher than the experimental results. However, other studies achieved 1%–3% moisture content (Carneiro et al., 2013; Karrar et al., 2021).
High moisture content can lead to particle deposition on the spray dryer wall, reducing product yield. This study observed this issue, where microcapsules with MS had the highest moisture content and the lowest yield. Nevertheless, all the moisture content values obtained in this research were below 6%, which meets the acceptable standards for food powders (Mahdi et al., 2020).
The EE compares the phenolic content trapped within the entire microcapsule (total oil) to the phenolic content present on the particle’s surface (surface oil). As shown in Table 4, the EE of the microcapsules ranges from 15.91% to 67.16%. MD and MS exhibited lower EE than other wall materials. This finding aligns with Cano-Higuita et al. (2015b), who reported that using 100% MD or 100% MS results in lower EE than combination between GA-MD and GA-MS. MD has a low emulsifying capacity, leading to low EE when used as a single-wall material. However, combining MD and MS (MD:MS = 50:50) can increase EE to 43% because MS provides good oil retention and low surface oil (Fernandes et al., 2014).
During encapsulation, polymer networks form between polysaccharides and MD, which can bind more active compounds inside (Lee and Chang, 2020). Among the three single-wall materials (MD, MS, GA), GA provided microcapsules with the highest EE. This result is consistent with the microencapsulation of cardamom oleoresin, where GA was the best wall material compared to MD and MS (Krishnan et al., 2005). GA is commonly used as an encapsulating agent in spray drying due to its superior emulsifying properties and good oil retention (Fernandes et al., 2014). However, the GA supply is limited and expensive, prompting efforts to mix or replace it with other materials to reduce costs (Ribeiro et al., 2020). The combination of GA and MD gave microcapsules with the highest EE (67.16%), demonstrating that this wall material combination is suitable for encapsulating sappan wood extract.
PR compares the phenolic content in microcapsules with the phenolic content of extract, as shown in Table 4. The PR ranged from 16.56% to 37.09%; MS 100% had the highest PR (37.08%) and GA 100% gave the lowest PR (16.56%). This result was lower than the PR of microencapsulated coffee ground extract, ranging from 33.59% to 58.48% (Ballesteros et al., 2017). The use of GA 100% gave the lowest phenolic retention, which is the same as this research, while the MD:GA combination gave the highest PR compared with MD 100% and GA 100%. Moreover, the PR is highly dependent on the active compounds encapsulated and the choice of wall materials. The PR of this research were also lower than the PR of microencapsulated citrus by-product extract, which ranged between 56.46% and 66.97%. Citrus by-product extract was microencapsulated using spray dryer with inlet temperature of 125°C and feed flow rate of 4 mL/min using MD, soybean protein isolate, and carrageenan as wall materials. The low phenolic content in microcapsules could be attributed to the degradation of phenolic due to the high inlet temperature of spray drying (Papoutsis et al., 2018). Table 4 also shows that although MS 100% gave the highest PR, it had low EE. The same result was found for microencapsulation of turmeric oleoresin using MD, MS and GA where MD 100% gave high curcumin retention but low EE (Cano-Higuita et al., 2015b). This means that many active compounds had been recovered in microcapsules, but most are stored on a solid surface; hence, it was not protected well by the wall materials, and these conditions can lead to rapid degradation (Cano-Higuita et al., 2015b).
Particle size distribution provides crucial insights into the behavior of microparticles, predicting their stability and influencing the flowability, appearance, and dispersibility of powders (Fernandes et al., 2014; Lucas et al., 2020). In spray drying, particle size depends on atomizer characteristics and the wall materials’ properties (Cano-Higuita et al., 2015a). Fig. 1 illustrates the particle size distribution, while Table 5 presents the average diameter and span number.
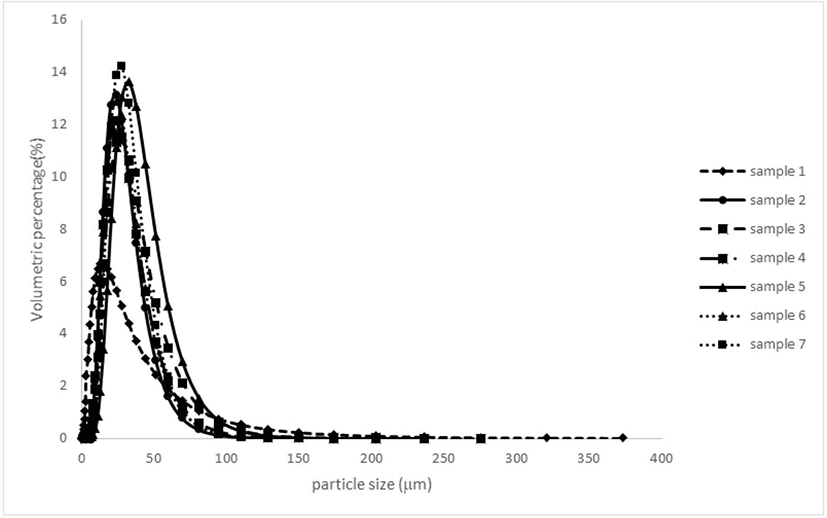
| MD:MS:GA (%) | Davg (μm) | Span |
|---|---|---|
| 100:0:0 | 19.765 | 2.889 |
| 0:100:0 | 23.868 | 1.249 |
| 0:0:100 | 28.064 | 1.457 |
| 50:50:0 | 24.863 | 1.370 |
| 50:0:50 | 32.650 | 1.200 |
| 0:50:50 | 25.044 | 1.278 |
| 33.3:33.3:33.3 | 26.986 | 1.140 |
All curves in Fig. 1 exhibit a single peak distribution, with average particle diameters ranging from 19.765 μm to 32.65 μm. A single peak distribution indicates no particle agglomeration (Ribeiro et al., 2020). The microparticles produced with 100% MD had the smallest average diameter, while those made with an MD and GA combination had the largest. Other wall material compositions resulted in similar average diameters, ranging between 23–28 μm.
Higher particle sizes can result from the increased viscosity of the polymers used. Higher feed viscosity produces larger droplets during atomization, leading to larger particle sizes (Fernandes et al., 2014). MD, which has low viscosity even at high concentrations, produced the smallest average diameter particles. Carneiro et al. (2013) also found that an MD and AG combination produced larger particles than an MD and MS combination or inulin, likely due to the higher emulsion viscosity of the feed.
In addition, to having the smallest particle size, MD also showed higher heterogeneity, as indicated by a larger span number than other wall materials. Other wall materials had smaller span numbers, signifying more homogeneous particle distributions. Encapsulating rosemary essential oil using MD, GA, MS, and inulin gave a span number range of 1.75–2.47, indicating a homogeneous distribution (Fernandes et al., 2014). In general, the span number for spray-dried microparticles ranges between 0.88 and 2.59 (Böger et al., 2021), and some results in this research are appropriate in that range except for MD, which had a span number exceeding 2.59.
Fig. 2 illustrates the morphology of microcapsules derived from various wall materials. Generally, all microcapsules exhibit a spherical shape with minimal observable imperfections but display some indentations. The globular or spherical form of the powder is a consequence of rapid water evaporation during the spray drying process (Santana et al., 2016). The smooth surface and absence of cracks confer advantages to the microcapsules, enhancing their ability to protect and retain active materials while exhibiting low permeability to gases (Alvarenga Botrel et al., 2012; Cano-Higuita et al., 2015b; Carneiro et al., 2013). Additionally, the variation in microcapsule size depicted in Fig. 2 is characteristic of the spray drying result, indicating the effect of using any wall materials.
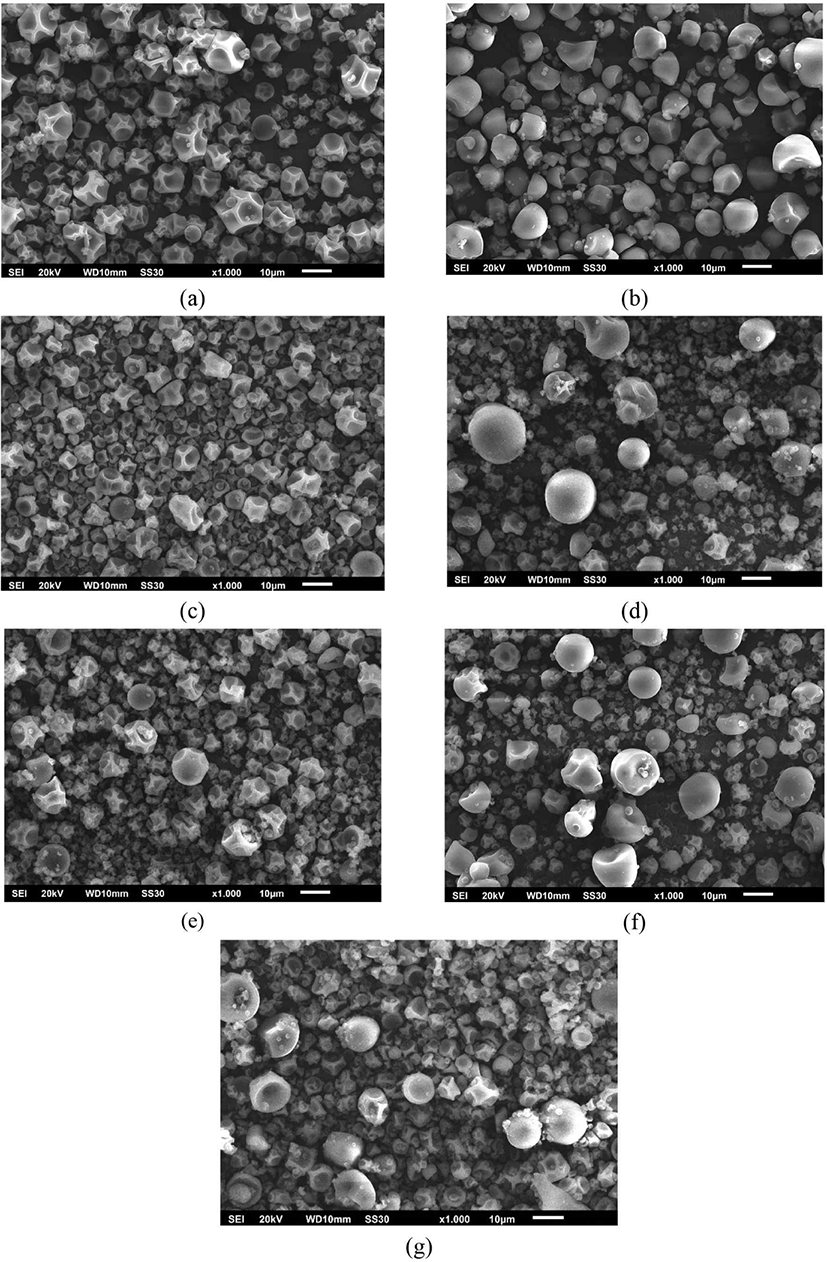
Among the materials used, MS microcapsules display a smoother surface and fewer surface irregularities than other wall materials. Surface irregularities, such as “teeth,” arise when the film formation during droplet atomization occurs slowly, generally leading to surface depression and droplet collapse during the initial drying stage (Carneiro et al., 2013; Santana et al., 2016).
Microcapsules produced from MD 100% exhibit similar characteristics to microcapsules produced from GA 100%, displaying spherical particles with some wrinkles, akin to the encapsulation of rosemary aroma and spent coffee grounds (Alvarenga Botrel et al., 2012; Ballesteros et al., 2017). The incorporation of MS as a wall material reduces these wrinkles. Cano-Higuita et al. (2015b) observed that a combination of MD:MS (0.75: 0.25) yielded slightly circular sizes with wrinkles but no cracks, while the use of GA and a mixture of MD:GA: MS produced a smooth surface with some irregularities. Encapsulated cardamom oleoresin using GA, MD, and MS gave GA produced spherical capsules with numerous indentations, whereas MD and MS yielded partially disrupted microcapsules (Krishnan et al., 2005). Furthermore, the compatibility of wall materials with the encapsulated active compounds results in spherical microcapsules with smooth surfaces.
Microcapsules produced via the spray drying process typically exhibit hollow spherical structures. During drying, the outer surface hardens, expanding air bubbles trapped within the droplet. This results in shrinkage and the formation of hollow sections within the capsule (Cano-Higuita et al., 2015b).
Microencapsulation is a method that protects active components and allows for controlled release mechanisms. The release process depends on various factors, such as the materials used for the capsule wall, the active components, and their interactions (Chaumun et al., 2020). Fig. 3 illustrates the release curves of the microcapsules, and Table 6 presents the constants of the models employed. All microcapsules released their contents rapidly, with release percentages ranging from 30% to 80% within the first minute. This release duration, though longer than that of Laurus nobilis extract, was shorter than that of vitamin B12 (Chaumun et al., 2020) and comparable to the release time of betacyanin micro capsules using GA and sodium alginate as wall materials (Bhagya Raj and Dash, 2022).
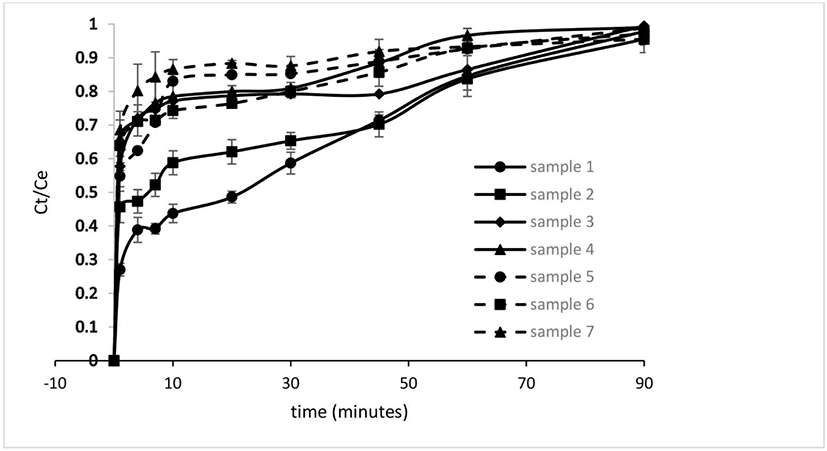
The release of bioactives in microcapsules typically involves three stages: surface release, followed by diffusion and erosion. Surface release often occurs due to incomplete entrapment of the active compound within the matrix, with subsequent release predominantly governed by diffusion and erosion stages (Flores and Kong, 2017). Among the five models investigated, the Korsmeyer-Peppas and Weibull models were most suitable for predicting the release profile, exhibiting high R2 values (> 0.93), except for the Weibull model in sample 1 (MD 100%). This finding is consistent with the release model observed in tea extract, where the Weibull model was deemed appropriate (Baltrusch et al., 2022).
The diffusional exponent constant (n) in the Korsmeyer-Peppas model is used to determine the release mechanism. A constant n < 0.43 indicates Fickian diffusion (case I transport), 0.43 < n < 0.85 corresponds to non-Fickian diffusion and swelling, n ≥ 0.85 denotes case II transport, and n > 1 suggests super case II transport (Bhagya Raj and Dash, 2022; Flores and Kong, 2017). A higher kKP value and a lower n value in the Korsmeyer-Peppas model signify faster release of the active compound. All microcapsules produced in this research exhibited n < 0.43, so the release process followed Fickian diffusion. This result indicates that diffusion rate was lower than that of microcapsule wall loosening, thereby controlling the release process (Kanha et al., 2021). Additionally, based on the values of kKP and n, MD 100% had the slowest release, while the combination of MD:MS:GA (33.3:33.3:33.3) resulted in the fastest release.
4. CONCLUSIONS
This study investigated the microencapsulation of sappan wood extract using spray drying with wall materials, including MD, MS, and GA, and their combinations. The yields of microencapsulated ranged from 43.84% to 69.62%, with 100% GA producing the highest yield (69.62%) due to its excellent film-forming properties. Bulk densities ranged from 0.358 g/mL to 0.583 g/mL, with MS contributing to higher densities (0.583 g/mL), enhancing storage stability. All microcapsules’ moisture content was below 6%, ensuring stability and preventing microbial growth. The microencapsulation process produced spherical particles with some dents but no apparent cracks. The Korsmeyer-Peppas and Weibull models were suitable for describing the microcapsules’ release kinetics. Considering all parameters and the cost of GA, the combination of MD and GA (50:50) appears to be the optimum wall material for microencapsulation sappan wood extract, offering high EE, suitable moisture content, and desirable particle morphology. These findings are directly applicable to the food, pharmaceutical, and cosmetic industries for developing stable and effective delivery systems for phenolic compounds, enhancing the shelf life and bioavailability of natural extracts.