


1. INTRODUCTION
Internal friction in wood, also known as damping, is the general term for mechanisms converting elastic energy into heat, playing a role as a damping factor. Alongside the speed of sound, internal friction is considered one of the vibrational properties of wood and depends on its orientation (longitudinal, radial, and tangential; Afzalinia and Roberge, 2007; Radhamani and Balakrishnan, 2023; Weller and Wert, 1983).
Scientific literature indicates a substantial number of publications dedicated to investigating internal friction in wood (Ha et al., 2023; Kalasee et al., 2023). Studies have been conducted to explore the relationships between the characteristics of natural wood and internal stresses, viscoelastic and vibrational properties, hysteresis damping, the dependency of vibrational properties on anatomical structure, and geometric, and mechanical properties of wooden structures (Alkadri et al., 2018; Brémaud et al., 2012; Clair, 2012; Grigorev et al., 2014; Kunickaya et al., 2019a, 2019b; Labonnote et al., 2013; Lukina et al., 2022). Additionally, attempts have been made to study the frequency characteristics and modes of natural vibrations and correlations between wood moisture content and damping behavior (Göken, 2018; Ouis, 2022). Efforts are underway to adapt the findings in the field of internal friction studies to develop non-destructive density determination techniques, enhance the mechanical efficiency of wood materials, create metamaterials, design wooden structures with high mechanical energy dissipation, increase resource conservation in wood panel production, and enhance key consumer values in the production and operation of frictional products and tribological setups (Fitzgerald et al., 2021; Gao et al., 2017; Gonzalez et al., 2022; Yin et al., 2022).
The findings indicated that the internal friction tanδ value exhibited a threefold higher vulnerability to electromagnetic compatibility (EMC) alterations in comparison to the E′/γ value (Brémaud and Gril, 2021). The radial (R) properties, namely tanδR, showed much greater sensitivity than the longitudinal (L) properties, resulting in a noticeable increase in anisotropy as the EMC rose. The impact of EMC on the elastic modulus (E′/γ) in the L direction was quite minor when compared to the inherent fluctuations in wood. Nevertheless, the impact of EMC on the damping factor, tanδ, was as substantial as the inherent fluctuations seen in high-quality spruce. The vibrational properties displayed hysteresis concerning relative humidity (RH) but showed little hysteresis concerning equilibrium moisture content. The relationship between tanδ and EMC is significantly affected by the precise duration required for stabilization to happen after equilibrium moisture content is reached.
The empirical data obtained from the research conducted by academics provides evidence supporting the existence of a certain moisture threshold that limits the occurrence of internal friction (Senalik and Farber, 2021). The internal friction experiences a rise on both sides of the minimum value as the moisture content approaches zero or reaches the fiber saturation limit. The temperature is a clear determinant of the moisture content at which the lowest internal friction is seen. Likewise, there exist certain temperatures at which the occurrence of internal friction is reduced, and the determination of the lowest level of internal friction is contingent upon the moisture content. An increase in the temperatures at which little internal friction occurs is seen when the quantity of moisture drops. In the case of wood with high moisture content, there exists a consistent inclination for the internal friction to diminish with rising temperatures.
The mechanical characteristics of sawdust and wood chips were measured at five different moisture levels (Stasiak et al., 2015), which is valuable information for process design and management. The relationship between the moisture content of the material and the elastic modulus has been firmly established. The elastic modulus of dry wood chips was measured to be 0.33 MPa, but at 50% humidity, it was found to be 0.25 MPa. The mean angle of internal friction for sawdust was 27°, whereas for wood chips it was roughly 33°. The angle of internal friction ranged from 34° for sawdust to 42° for wood chips. An inverse correlation was detected between the internal friction angle and the moisture content of sawdust. The authors showed that the angles of internal friction from wood were higher than from straw (Swietochowski et al., 2018).
Table 1 demonstrates that the wooden chips have the highest angles in comparison with wooden pellets (Wu et al., 2011).
| Material of wood | Size (mm) | Angle (°) |
|---|---|---|
| Pellets | < 6 | 37 |
| < 8 | 41 | |
| < 12 | 35 | |
| Chips | < 20 | 45 |
| < 40 | 47 | |
| < 100 | 47 |
The research was undertaken by the authors to investigate the internal friction angle and friction coefficient of various surface types, with rapeseed serving as the model material (Xu et al., 2019). A direct shear apparatus was used for the purpose of their inquiry. The researchers furthermore developed prediction models via the process of fitting the empirical data. The rapeseed exhibited an internal friction angle ranging from 24 to 35 degrees. During normal stress conditions, it exhibited a decline and an increase in response to moisture levels.
The research measured the dynamic elastic modulus and internal friction of beech wood at various equilibrium moisture levels within a temperature range of −130°C to 25°C (Sellevold et al., 1975). The response curves show a notable displacement at around –90°C for wood samples with moisture levels equivalent to or above the fiber saturation threshold. The transition is analogous to that seen in other microporous materials that can absorb water, such as solidified cement paste and permeable glass. Lowering the moisture content in the wood reduces the magnitude of the transition and leads to its occurrence at higher temperatures. We hypothesize that the shift is caused by the gradual solidification, sometimes referred to as the “glass transition,” of the water that has been adsorbed.
In the study Russu et al. (2023), prepared samples of natural and modified wood, cut from the stem part of birch, and were subjected to ultrasonic and pulsed magnetic field treatments in radial and tangential directions. The highest level of approximation was achieved in testing samples of pendulous birch natural wood (R2 = 0.98) for the radial direction.
Analysis of existing studies indicates that research in the direction of studying internal friction in wood is being actively pursued. At the same time, it is notable that there is a lack of comprehensive and precise understanding of the physical nature of dissipation and relaxation processes in wood, hindering the development of physical and mathematical descriptions of regularities. This is relevant both theoretically and practically, as it allows for establishing correlations between the properties of internal material structures, obtaining new insights into processes within the substance structure, and their influence on the main macroscopic material characteristics.
The objective of this study is to obtain experimental data and mathematical dependencies of the magnitude of internal friction on factors such as density, temperature, humidity, ultrasonic treatment, and pulsed magnetic field, as well as to develop mathematical models that adequately describe them, to find optimal solutions.
For this research, natural and stained oak wood is chosen as the experimental material. The selection of natural and stained oak wood is motivated by limited data available on these materials in the specific segment of the scientific and technical literature, as well as their undeniable value for the end consumer.
2. MATERIALS and METHODS
For the experiment, specimens of healthy natural wood (Quercus robur) were used, obtained from the Voronezh region, Russian Federation. Specimens of stained oak were obtained from wood harvested in the Medveditsa River (a tributary of the Oka River) in the Tver region (40 km from the city of Tver), Russian Federation.
The physical and mechanical properties of the wood species used are presented in Table 2.
The appearance of the specimens was assessed visually. Quality control was conducted during specimen preparation, ensuring that specimens with cracks, knots, decay, and other defects were not included. For the experiment, specimens of the following geometric dimensions were cut: length 500 mm, width 42 mm, thickness 2.5 mm.
The surface roughness of wood specimens can significantly affect their mechanical properties, including damping. To minimize the impact of surface roughness on experimental results, it is essential to process the specimens to achieve a consistent and acceptable level of roughness. We used fine sandpaper to smooth the surface of the wood specimens [start with a coarser grit (120) and progress to finer grits (220) to achieve a smooth finish]. After processing, we inspected the surface of the specimens using surface roughness testers to ensure the desired roughness level (Ra below 10 micrometers) according to ISO 21920-2:2021 Geometrical product specifications (GPS) – Surface texture: Profile.
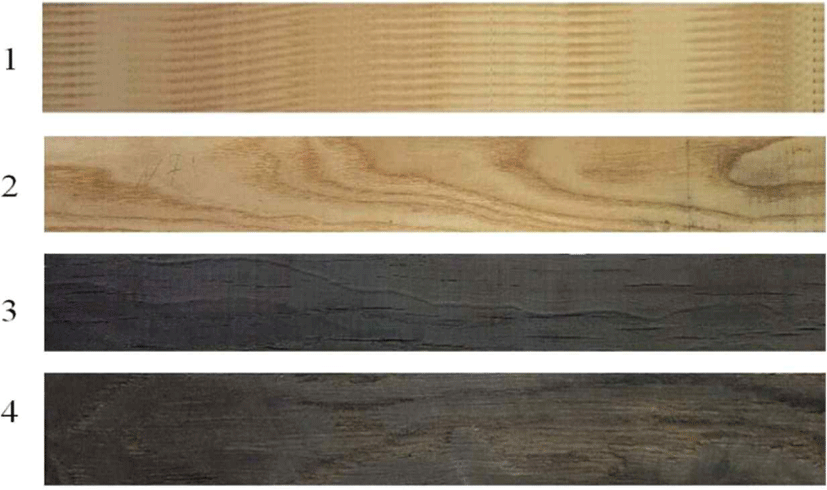
Prior to testing, the specimens were weighed, and their density was determined. A minimum of three specimens were required for each condition. The visual appearance of the specimens is illustrated in Fig. 1.
When determining internal friction using the method of free decaying flexural vibrations, the following relationship is employed:
Where Q-1 represents internal friction, δ denotes the logarithmic decrement of damping, and An and An+1 are the amplitudes of neighboring vibration periods.
Thus, the magnitude of internal friction and the logarithmic decrement of damping can be equivalently utilized to describe experimental dependencies obtained through the method of free flexural vibrations.
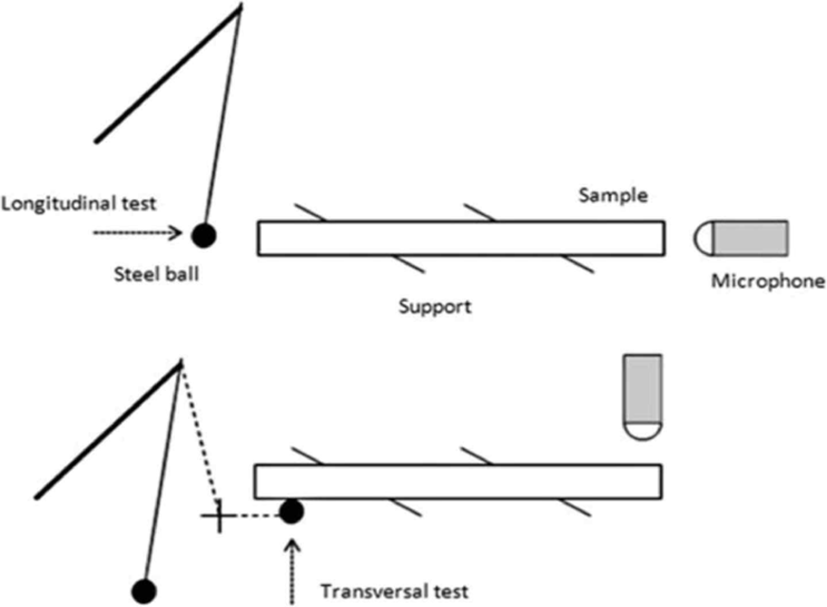
The BING device was used (Traore et al., 2010). The test rests on two rigid supports (nylon threads 17 cm long and 0.35 mm in diameter) or elastic supports (Fig. 2). Whenever possible, the supports are placed on the vibration nodes of the fundamental frequency. The specimen is impacted at one end with a 13-mm-diameter steel ball weighing 9 g (bending or compression vibration depending on the orientation of the impact). A microphone is placed at a distance of 2 cm from the other end of the specimen. The microphone is unidirectional, type EMU4535 (Lem Industries, Bucine, Italy). The analog-to-digital converter is a Picoscope 3224 (Pico Technology, Eaton Socon, UK). It possesses a 12-bit resolution. The antialiasing filter was set to the Nyquist-Shannon frequency. Recordings were not performed in an anechoic room.
The experimental setup for generating free decaying oscillations is depicted in Fig. 3. The temperature and humidity of the working environment for conducting experiments were maintained at 22°C and 68%, respectively.
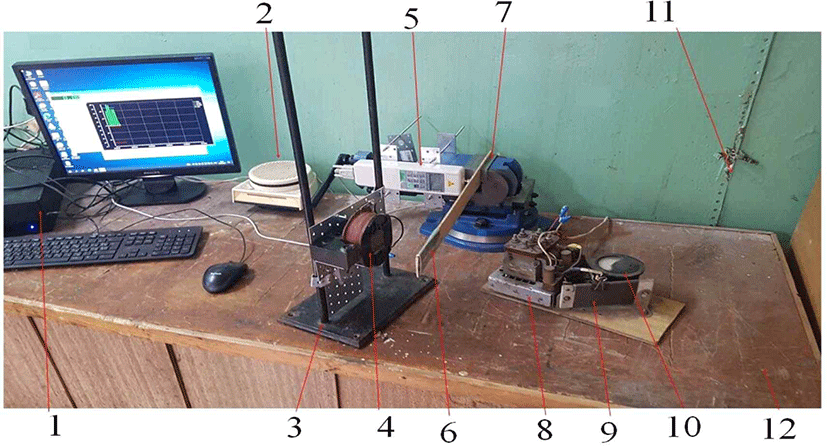
The development of the laboratory equipment was carried out based on the findings of the study (Brancheriau et al., 2010). In this research, the authors were able to demonstrate that the type of support significantly influences the measurement of temporary damping; measurements of temporary damping obtained from flexural free vibration are linearly correlated with measurements obtained from compressional vibration.
The sample is securely fastened cantilever-style using a three-position clamping fixture on a sturdy base. Bending occurs in the horizontal plane. To induce and establish initial bending stress, an electromagnet was utilized (Fig. 3, position 4). The response of the wooden sample to the magnetic field is facilitated by a thin strip (0.02 mm thick), weighing no more than 0.6 g, made of permalloy (alloy 79NM) with magnetic-soft properties and high coercive force. The strip is attached to a small portion of the free end of the sample (Fig. 3, position 6). The magnitude of the initial force required to induce free decaying bending oscillations, ranging from 10 to 50 N, is controlled by the magnetic field of the electromagnet (Fig. 3, position 4). The distance from the fastening point to the measurement point is 35 mm and can vary from 0 to 100 mm. The parameters measured during the experiment are listed in Table 3.
The technical specifications of the ultrasonic bath are provided in Table 4.
| Name | Unit | Value |
|---|---|---|
| Operating frequency | kHz | 24.0 ± 7.5% |
| Ultrasonic power | W | 80 |
The technical specifications of the pulsed magnetic field generator are presented in Table 5.
| Name | Unit meas. | Meaning |
|---|---|---|
| Maximum magnetic field induction | T | 0.3 |
| Pulse current | kA | 2 |
| Number of pulses during processing | 3,000 / 6,000 | |
| Pulse frequency | Hz | 100 |
| Pulse duration | 10−6 s | 10 |
Thus, the testing methods, measuring instruments, and devices used in the experiment comply with the necessary regulatory documents, and the maximum relative measurement error did not exceed 1%.
The experiment is based on a full factorial design. We will seek a mathematical description of the experiment in the form of polynomials, taking into account the nonlinearity of factor interactions. In general, when the number of varied factors is equal to k, the model of the object has the form:
Where bm…n are the theoretical regression coefficients.
In this case, 5 factors will be used for variation: x1: density (ρ), x2: temperature (T), x3: humidity (w), x4: ultrasonic treatment (u), x5: pulsed magnetic field (m).
For 5 factors, the number of regression coefficients is 21. Table 6 presents the natural and formalized factors.
Let’s determine the sample size (the number of experiment repetitions) n:
Where t is the Student's coefficient, s2 is the sample variance, Δ is the magnitude of the maximum error.
Taking into account the degrees of freedom f = 9 and the confidence probability p = 0.95, we obtain the significance level q = 0.05 and the value of Student’s coefficient t = 2.262. Let’s assume s2> = 5·10−5 and set Δ = 5·10−2. Then, the calculation yields n = 10, 23..., which, when rounded to the nearest integer, gives the minimum number of repetitions for each experiment (the minimum sample size) as 10.
To conduct a regression analysis, the following requirements must be met: homogeneity of variances (Cochran’s criterion), i.e., the absence of any variances that significantly exceed all others; absence of gross errors (Grubbs’ criterion); homogeneity of variances ensures the orthogonality and rotatability of the design.
In this study, a one-sided Grubbs’ criterion (Smirnov-Grubbs criterion) was utilized, indicating the relative deviation of the tested quantity y from its mean value in units of the SD (Göken, 2018):
Where Gr is the Grubbs’ criterion, y is the tested value, ȳ is the sample mean, s is the sample SD.
According to the verification results, the condition should be met:
Where Grmax is the theoretical (tabulated) value of the Grubbs’ criterion.
At a significance level of 0.05 and a sample size of 10, the value of Grmax = 2.176.
The hypothesis testing for the homogeneity of variances (dispersion characteristics) can be conducted using Cochran’s criterion since the number of experiment repetitions in each case is the same:
To accept the hypothesis, it is necessary to meet the requirement:
At a significance level of 0.05, with 32 experiments and a sample size of each experiment being 10, the value of G0.05;9;32 = 0.0902.
After verifying the homogeneity of variances, we proceed to compute the variance of experiment reproducibility S2y:
Subsequently, utilizing the obtained experimental data, the model coefficients bi…n are computed using known formulas (Göken, 2018).
Following the calculation of the model coefficients, their significance is assessed using Student’s criterion:
After calculating the model coefficients and verifying their significance, the adequacy variance is determined using the Fisher F criterion Fад:
Where l is the number of significant coefficients in the regression equation, ȳi is the mean response value in the i-th experiment, y*i is the calculated response value according to the regression equation in the i-th experiment.
3. RESULTS and DISCUSSION
As the investigated response function model involves five factors, we first evaluate the role of each factor separately using functions in a two-dimensional plane.
The density factor is represented by two values of natural (625 kg/m3) and steamed (775 kg/m3) oak wood. Clearly, the graph represents a straight line. Visualization of the experimental data for the other four factors is presented in Figs. 4–8.
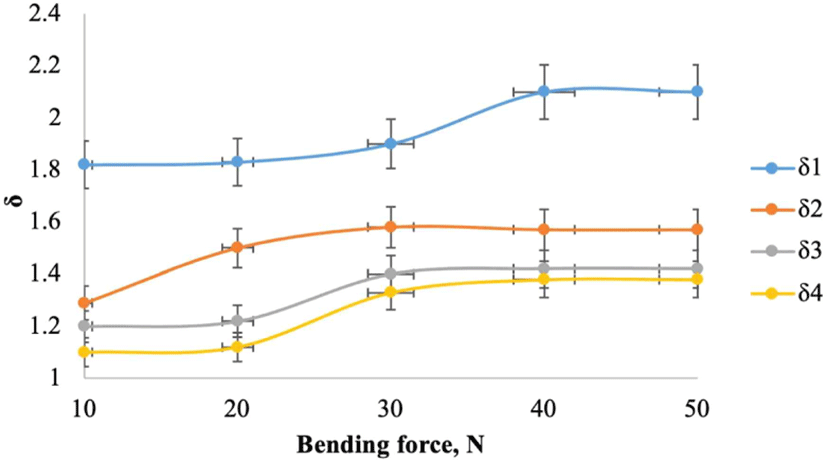
In the initial stage, it was necessary to determine at what external force magnitude, based on the sample sizes and the strength limit of the corresponding species of natural or modified wood, further experimental work should be conducted. Therefore, measurements of the logarithmic decrement of damping δ were performed for all samples in the range of external force from 10 N to 50 N.
Fig. 4 clearly shows that at the magnitude of 30 N, there is a change in the curvature slope of the graph. Attention is drawn to the fact that between the changes in the δ value in the radial and tangential directions, as seen in Fig. 4, a certain similarity is established. This is associated with the increase in stress in the sample, resulting in approaching the limit of mechanical strength.
For natural oak, the increase in δ in the radial direction was approximately 20%, while in the tangential direction, it was around 30%. For steamed oak, the pattern in the radial direction was similar to that of natural oak, with an increase in δ of about 23% (Fig. 4), whereas in the tangential direction, it was significantly lower, around 11%. The curve trend for stained oak in the tangential direction indicated that besides mechanical factors, the change in the microstructure also influenced the magnitude of the logarithmic decrement of damping. A comparison of the graphs of natural oak and steamed oak (Fig. 4) revealed that for the former, the graph in the radial direction was higher than in the tangential direction, while for the latter, it was the opposite. The reasons for this phenomenon lie in the change in the microstructure and molecular composition of steamed oak, particularly the increased presence of iron.
A characteristic feature observed in all wood samples used in the experiment is the attainment of a stable plateau region in δ at an external bending force magnitude of 40 N or higher (Fig. 4). The most distinctive inflection is observed at an external bending force of 30 N. Since no sharp transitions in the magnitude of δ were observed within the range of external bending forces for all wood samples, it can be inferred that the variation of this quantity is continuous.
Based on the analysis of the curves in Fig. 4, an external bending force magnitude of 40 N was selected for further investigation.
When assessing the influence of the temperature field (Fig. 5), for natural oak, the increase in δ in the radial direction was approximately 7%, while in the tangential direction, it was around 6%. For steamed oak samples, the increase in δ in the radial direction was approximately 6%, while in the tangential direction, it was around 9%. Notably, the tangential direction of steamed oak exhibited the highest magnitude of δ compared to other samples.
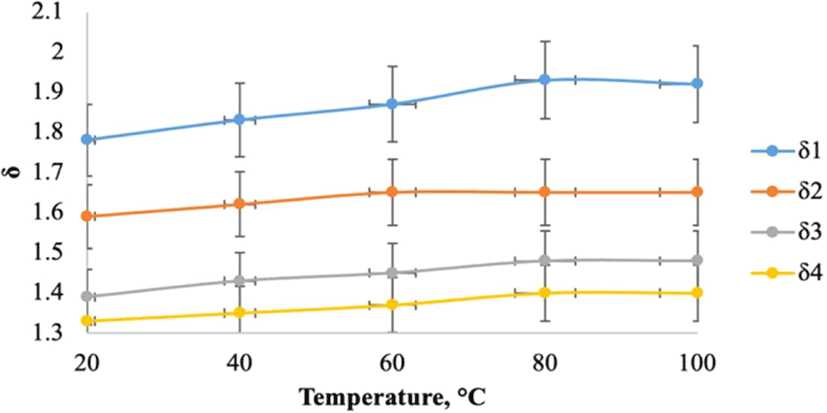
In the case of increasing positive temperatures, the thermal effect on wood leads to an expansion in volume, thereby serving as a factor in the growth of internal stresses. It was experimentally determined that there is also a slight increase in the magnitude of δ. This was the observed pattern for the specimens investigated by us.
Moisture content significantly influences the technical properties of wood. For quantitative assessment, we utilize the RH of wood expressed in percentages. In this study, humidity varied within the range of 0% to 40%. The experimental results are presented in Fig. 6. For all specimens, a significant increase in the magnitude of δ and a transition to a “plateau” was observed at a humidity level of 30% or higher. It is evident that at 30%, this represents the point of hygroscopic moisture, hence further increases in humidity do not affect the mechanical properties of wood.
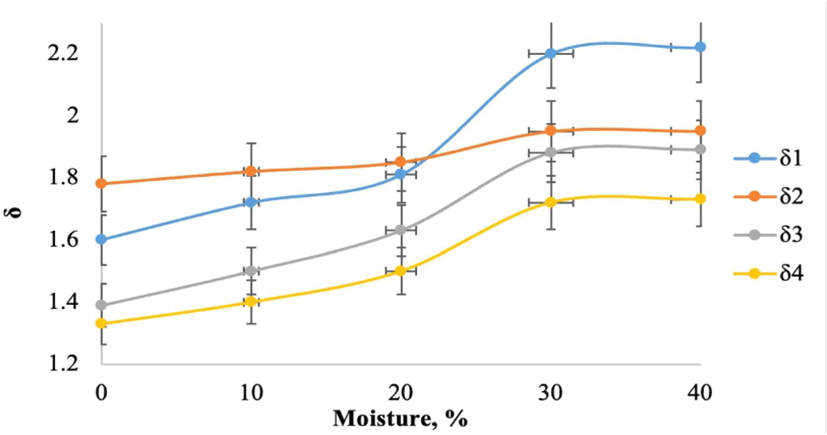
When assessing the influence of humidity (Fig. 6), for natural oak, the growth of δ in the radial direction was approximately 37%, and in the tangential direction, it was about 31%. For samples of steamed oak, the growth of δ in the radial direction was approximately 41%, and in the tangential direction, it was around 10%, which is nearly three times less than that for natural oak wood.
Thus, the influence of humidity on the magnitude of the logarithmic decrement of damping is more significant than the influence of the temperature field. Moreover, in some cases, the relative increase reaches a threefold growth. Only for the tangential direction of steamed oak wood does the influence of temperature and humidity contribute approximately equally to the overall effect.
Senalik and Farber (2021) describe the moisture level at which internal friction is minimal. Internal friction increases on both sides of this minimum as moisture content decreases to zero or reaches the fiber saturation point. Temperature determines moisture content and minimum internal friction. The minimum internal friction at a moisture content is approximately 6% at 23°C; at –20°C, it is 14%; and at 70°C, it is 4%. The minimum temperature at 90°C is not defined and is observed in the absence of moisture. There are also temperatures of minimum internal friction and temperatures of maximum internal friction, which vary depending on moisture content. As moisture content decreases, the temperature of minimum internal friction increases. Internal friction significantly increases at temperatures above 0°C and moisture content above 10%, accompanied by a strong positive interaction with moisture content. Internal friction decreases with increasing temperature for very dry wood. The logarithmic decrement of hot moist wood is approximately 0.1, while for hot dry wood, it is less than 0.02. Cold wood, regardless of moisture content, will be acceptable.
Brémaud and Gril (2021) conducted experiments on two different wood kinds, namely softwood (spruce) and hardwood (maple), in both the longitudinal (L) and radial (R) orientations. The R properties, namely tanδR, showed much greater sensitivity (2–3 times) than the L properties, resulting in a noticeable increase in anisotropy as the EMC rose.
The propagation of ultrasonic waves in a medium ensures the periodicity of compression and rarefaction processes of the medium’s components. The influence of ultrasound was found to be quite significant for all tested samples (Fig. 7). Considering the sample processing technology, the moisture content of the samples was maintained at 20 ± 1%. Additional measurements of processing duration were conducted for 20 minutes to determine the behavior of the logarithmic decrement curve, taking into account the maximum duration of ultrasonic treatment, which was 15 minutes. The experiment revealed that when the duration of ultrasonic treatment exceeded 15 minutes, the curves reached a plateau.
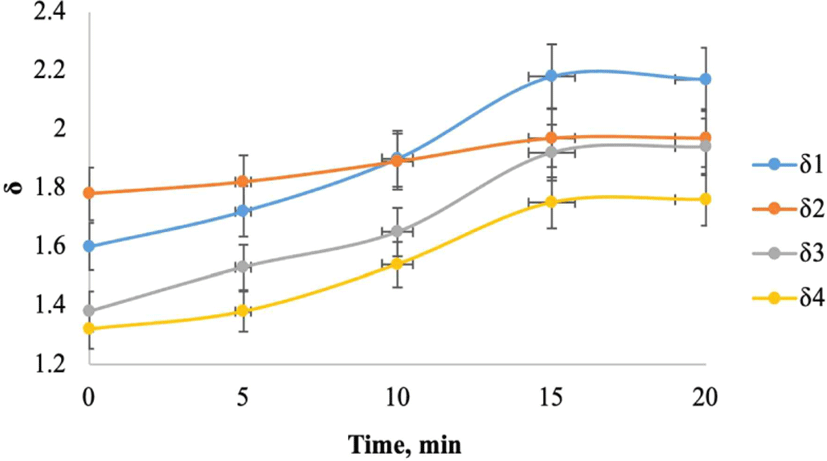
When assessing the influence of ultrasound (Fig. 7), for natural oak, the growth of δ in the radial direction was approximately 41%, and in the tangential direction, it was approximately 34%. For samples of bog oak, the corresponding growth of δ in the radial direction was approximately 37%, and in the tangential direction, it was approximately 11%, which is nearly three times less than for natural oak wood. This relationship is analogous to the influence of moisture discussed above. It should be noted that the ultrasonic effect had a slightly greater impact on the magnitude of δ in the samples compared to moisture. This is due to the physics of the wave process, which significantly affects the macroscopic and microscopic characteristics of the medium, forming ordered structures in a certain way.
The graphs illustrating the influence of weak pulsed magnetic fields (PMF) on the magnitude of δ are presented in Fig. 8.
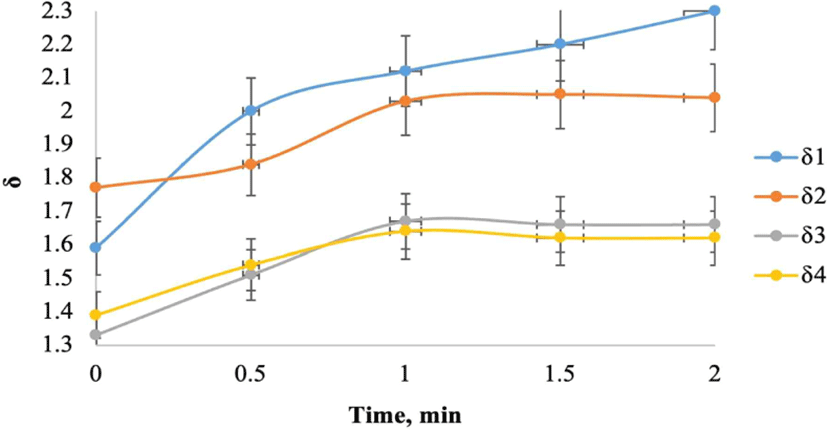
The magnetic field was applied in a series of 1,500 to 6,000 symmetric triangular pulses with a duration of τ = 10 μs, an amplitude of B0 = 0.3 T (tesla), and a repetition frequency of 10 ms (milliseconds). During the exposure, the samples were positioned such that the wood fibers were parallel to the direction of the field.
A characteristic feature for all samples was the plateauing of the δ curves within 60 seconds after the onset of magnetic field treatment.
When assessing the influence of the pulsed magnetic field (Fig. 8), for natural oak, the growth of δ in the radial direction was approximately 21%, and in the tangential direction, it was around 29%. For samples of stained oak, the growth of δ in the radial direction was approximately 42%, nearly twice as much as for natural oak, and in the tangential direction, it was about 17%.
The pulsed magnetic field, by affecting the internal microstructure of the wood, significantly influences the increase in the magnitude of the logarithmic decrement of damping within the first 60 seconds of treatment. The greatest enhancing effect on δ (~42%) was observed in samples of the radial direction of stained oak. Thus, overall, the influence of the pulsed magnetic field on the radial direction is noticeably greater than on the tangential direction.
Table 7 presents the percentage increase values of the logarithmic decrement of damping for natural and stained oak wood in the radial and tangential directions when varying temperature, humidity, as well as processing time under ultrasonic and pulsed magnetic fields.
The data presented in Table 7 indicate that the greatest influence on the increase in the value of the logarithmic decrement of natural oak is exerted by ultrasonic treatment (34%–41%), followed by an increase in humidity (31%–37%), treatment with a pulsed magnetic field (21%–29%), and lastly, temperature elevation (6%–7%). As for the stained oak, the greatest influence on the increase in the value of the logarithmic decrement is attributed to treatment with a pulsed magnetic field (17%–42%), followed by an increase in humidity (10%–41%), ultrasonic treatment (11%–37%), and lastly, temperature elevation (6%–9%).
The empirical dependencies obtained by us are consistent with the results of the study by Russu et al. (2023), where it was established that humidity, as well as treatment in ultrasonic and pulsed magnetic fields, have the most significant impact on increasing the value of the logarithmic decrement of natural and modified birch.
Ultrasonic and pulsed magnetic field treatments significantly impact the internal structure and channels of wood, thereby affecting its internal friction. Ultrasonic treatment increases the logarithmic decrement of damping by 34%–41% for natural oak through microstructural changes that enhance viscoelastic properties. Pulsed magnetic field treatment similarly increases damping by 17%–42% for stained oak, potentially altering its magnetic and structural properties. These treatments modify the wood's internal channels and structure, converting elastic energy into heat, and are influenced by environmental factors like humidity and temperature, as demonstrated through mathematical models predicting internal friction based on these variables.
Based on the proposed methodology, assessments of the obtained experimental data were conducted using the Grubbs' criterion. The experimental value of the Grubbs’ criterion, Gr = 2.116 < Grmax = 2.176. This indicates that there are no significant outliers in the experimental data.
The hypothesis of homogeneity of variances was tested using Cochran’s criterion: the experimental value G = 0.0468 < G0,05;32;10 = 0.0865. Therefore, the hypothesis of homogeneity of variances is accepted.
The reproducibility variance of the experiment is S2y = 8.999·10−3. The significance level is Δbi = 28.8·10−3.
After performing calculations and considering the significance level, we obtain the model - the final normalized regression equation for the logarithmic decrement of damping δr, (where r denotes the radial direction and, t the tangential direction), linearly associated with the internal friction magnitude:
Since the number of significant coefficients in the regression equation is l = 11, we find F0.05;21;10 = 2,764. Adequacy check has demonstrated that with a probability of p = 0,95, it can be asserted that the regression equation adequately approximates the response function.
Similarly, we obtain the second model for the tangential direction. All the data are compiled into a comprehensive Table 8.
Thus, experimental dependencies in the form of graphs and regression models have been obtained to describe the physico-mechanical interaction between external factors and wood material.
A comparative analysis of the regression coefficients of models for the radial direction of wood and the tangential direction revealed that density exerts an inverse influence in the radial direction compared to the tangential direction, with a difference of 4.6 times in absolute terms. Density as a factor is inconvenient for controlling the wood diagnostics process since it is an intrinsic material parameter. Nevertheless, its consideration is necessary, as comparing its magnitude for the radial direction reveals that it is only 6% less than the coefficient of influence of the impulse magnetic field factor. The temperature factor for the tangential direction is significantly higher by 30% than for the radial direction. The moisture factor is more significant for the radial direction than for the tangential direction by 25%. The ultrasonic field factor is more significant for the radial direction than for the tangential direction by 22%. The impulse magnetic field factor is more significant for the radial direction than for the tangential direction by 93%, nearly twice as much.
At the same time, comparing the coefficients reflecting the joint influence of factors, we notice that on average, this group effect is 86% greater in the tangential direction than in the radial direction. Investigating the reasons for the relationship between the joint action of two or more factors is a promising task that goes beyond the scope of our study at this stage and will be considered in the future.
Since the experiment was conducted under identical conditions, it is possible to rank the factors according to their degree of significance and technological feasibility. The greatest influence on the test samples was exerted by humidity and the ultrasonic field, followed by a slightly lesser influence from the impulse magnetic field. The thermal field had the weakest impact. Therefore, ultrasonic and impulse magnetic fields can be proposed as the most technologically feasible control parameters, while humidity, temperature, and density can be suggested as additional parameters.
Thus, it can be inferred that employing the internal friction magnitude as a criterion for assessing the structural quality of wood represents a promising idea.
Our findings align with the results of other researchers’ studies dedicated to exploring the relationship between the dissipative, acoustic, and mechanical characteristics of wood for the production of musical instruments (Hossen et al., 2018; Obataya et al., 2020; Shirmohammadi et al., 2021; Sproßmann et al., 2017). Extensive documentation exists about the impact of the microfibril angle inside the layer of the tracheid, specifically in relation to the L direction, on the internal friction value and Young’s modulus of wood (Ono and Norimoto, 1983). In addition, it should be noted that our research is consistent with the results of recent research in this field of deep manufacturing of wood (Gong et al., 2021; Hwang and Oh, 2021, 2024).
Internal friction in wood, the conversion of elastic energy into heat during deformation, is crucial for its processing and utilization. High internal friction enhances damping properties, essential for applications like musical instruments, where it reduces unwanted resonance, and in construction materials, where it dampens vibrations, improving structural stability. In furniture and sports equipment, higher internal friction means better shock absorption and longevity. Understanding and controlling internal friction through treatments like ultrasonic and pulsed magnetic fields, as explored in this article, optimizes wood’s mechanical properties and processing efficiency, reducing tool wear and energy consumption. This research provides valuable methods to enhance wood’s performance for specific applications, making it more reliable and effective across various industries, thereby highlighting its practical significance.
4. CONCLUSIONS
The study aimed to investigate the influence of density, temperature, humidity, and processing time under ultrasonic and pulsed magnetic fields on the internal friction of natural and stained oak wood. The internal friction magnitude was determined using the logarithmic decrement obtained by the free flexural vibration method. A full factorial design was employed for experimental planning. The study revealed that the logarithmic decrement for natural oak was δt = 1.40 for the tangential direction and δt = 1.34 for the radial direction, while for stained oak, it was δt = 1.59 and δt = 1.78, respectively. Ultrasonic treatment (34%–41%), humidity increase (31%–37%), pulsed magnetic field processing (21%–29%), and temperature elevation (6%–7%) had the most significant impact on increasing the logarithmic decrement of natural oak. Pulsed magnetic field processing (17%–42%), humidity increase (10%–41%), ultrasonic treatment (11%–37%), and temperature elevation (6%–9%) had the greatest influence on increasing the logarithmic decrement of stained oak.
Mathematical dependencies have been developed that allow predicting the magnitude of the logarithmic decrement of attenuation in natural and stained oak wood based on density, temperature, humidity, and processing time under ultrasonic and pulsed magnetic fields.
Further research should focus on increasing the number of examined samples of various species of both natural and modified (not only stained) wood, as well as on investigating wood with different defects, primarily cracks.