1. INTRODUCTION
Indonesia had a total population of 276.4 million in early 2023, with 58.2% living in urban centers while 41.8% living in rural areas (Kemp, 2023). In urban areas, the wastewater treatment capacity is limited to 0.3 km3/year despite the estimated 14.30 km3/year total volume of wastewater (Widyarani et al., 2022). Wastewater degrades water quality and endangers human health and aquatic biota (Sharma, 2015), so wastewater management has been a major challenge in the last decade (Renu et al., 2017).
Environmental pollution has consistently posed a significant issue, not only hindering industrial progress but also endangering public health. Organic dyes constitute a major pollution source given their extensive use in textile, paper, cosmetics, and various other sectors (Hanafi and Sapawe, 2020; Rani and Shanker, 2023). However, most of these dyes are harmful, possessing toxicity, carcinogenicity, and teratogenicity (Ivanova et al., 2023), and are challenging to naturally degrade through photodegradation or biodegradation (Groeneveld et al., 2023). Conventional wastewater treatment methods to reduce pollutants include oxidation and physical-chemical using activated carbon (Jiang et al., 2019), flocculation/coagulation (Barros et al., 2022), adsorption (Rashid et al., 2021), and membrane technology (Giacobbo and Bernardes, 2022). The use of synthetic and natural polymers is more widely used than inorganic adsorbents. Inorganic adsorbents have the disadvantage of being non-biodegradable, expensive, and nonselective (Sukmana et al., 2021). Efforts to reduce and improve the performance of natural adsorbent are needed so that the results of the adsorption process become biodegradable and ready to be disposed of to reduce overall costs by using cellulose from sawdust waste as an adsorbent.
Cellulose stands as the most abundant biopolymer on the earth with annual production of about 1.5 × 10¹² tons (Mahsuli et al., 2023). Total trade reached $5.86 billion in 2019 (Suryanto et al., 2023), and it is projected that by 2026, the cellulose trade will attain a value of approximately USD 305.08 billion (Fortune Business Insight, 2024) and most cellulose is derived from wood pulp. Indonesia’s 2017 log production reached 43.0 million m3 (Hadi et al., 2020) and increase in 2019 reached 48.0 million m3 (Haryanto et al., 2021) and with an estimated sawdust of 2 million m3/tahun (Mwango and Kambole, 2019), sawdust is a promising source for cellulose production. Several researchers reported sawdust can be extacted as natural dye (Mindaryani et al., 2023; Rahman et al., 2021), wood ceramics (Hwang and Oh, 2023, 2024), wood pellet (Yang et al., 2019), activated charcoal (Sutapa et al., 2024), board composite (Hwang and Oh, 2020, 2021) and as a low-cost absorbent (Kheradmand et al., 2022; Rahman et al., 2022). However, separating sawdust from treated wastewater is difficult and takes a long time (Teixeira et al., 2021). Besides, the cellulose surface has a low charge density that influences the dye adsorptive mechanism (Hussain et al., 2018). However, natural polymers like cellulose tend to degrade over time, causing lower floc stability and strength during the coagulation-flocculation process (Lee et al., 2012) and lower efficiency (Stefan et al., 2022). Increasing the performance of cellulose in dye adsorption has been carried out by making it a chemical modification through surface functionalization or copolymerization of cellulose ether (Koshani et al., 2020; Li et al., 2021) or by adding particles such as MoS2 (Thangavelu and Zou, 2022).
In recent years, there has been an increasing fascination with the progress of cellulose nanocomposites. Biodegradable polymers sourced from natural materials have sparked considerable interest due to environmental challenges like global warming and stringent regulations on polymer disposal (Gwon et al., 2018). These composites, reinforced with nanomaterials, can alter the characteristics of the nanocomposite material, resulting in additional and unique functionalities. Hydrophilic properties are attributed to Fe3O4 nanoparticles (Fe3O4-NPs), which facilitate the development of molecular bonds between hydroxyl groups and oxygen due to the surplus electrons from the hydroxyl groups (Kameya and Yabe, 2019) type of molecular bond is generated by the attractive force of the fibril to Fe3O4-NPs. Furthermore, the inclusion of mechanical interlocking further restricts the movement of cellulose fibrils by Fe3O4-NPs, consequently enhancing the mechanical properties of the nanocomposite (Elsacker et al., 2021; Yu et al., 2021). Remarkably, Fe3O4 systems have demonstrated efficacy in disinfecting coliform and enterococcus bacterial communities (Padmanabhan et al., 2021) and increasing the charge capacitance ability of cellulose material (Yamklang et al., 2023). Efforts to facilitate the separation system in wastewater treatment are made by functionalizing Fe3O4 magnetic nanoparticles into cellulose so they will be easily separated with a magnet when applied as a wastewater coagulant or dye adsorbent. So, the objective of this study is to observe the characteristics of sawdust cellulose powder (SCP) of Sengon (Albizia chinensis) wood with the functionalization of magnetic nanoparticles of Fe3O4 for dye removal from wastewater. The properties of the adsorbent were identified by testing procedures, including crystallinity of magnetic cellulose structure using X-ray diffraction (XRD), functional group analysis using Fourier transform infrared (FTIR), morphology using scanning electron microscope (SEM), magnetic properties analysis using vibrating sample magnetometer (VSM) and porosity using Brunauer Emmett Teller (BET), and dye adsorption using UV-Vis spectrometer.
2. MATERIALS and METHODS
The magnetic cellulose used sawdust waste of Sengon wood with an age of about 5 years, obtained from Malang Regency, Indonesia. Chemical reagents in this study include sodium hydroxide/NaOH (Merck, Singapore), hydrogen peroxide/H2O2 (Merck), Fe3O4-NPs with particles size of 30–50 nm (Guangzhou Hongwu Material Technology, Guangzhou, China), and Methylene Blue and Congo Red dye (Surya Techno Chemlab, Jawa Timur, Indonesia).
The sawdust was crushed to make it powdery for 10 minutes. Sawdust powder passed with 80 mesh sieve was used for further process. 100 grams of powder was immersed in 4 liters of water for 1 week, with the water changed every 2 days to clean material that was dissolved by water. The sawdust powder is then oven-dried at 110°C–120°C for 20 hours. Each 4 grams of powder was then alkalized with 80 mL of 5% NaOH (w/v) solution carried out on hot plate at 180°C for 3 hours. Sawdust powder was rinsed 4 times and soaked for 3 hours with 500 mL distilled water. The alkalization process was repeated 4 times.
10% dry SCP was mixed with 10% H2O2 solution (5 g cellulose for 100 mL H2O2), then the pH was adjusted to 11.5 with sodium hydroxide and stirred for 30 minutes at 80°C. Once the reaction occurred, the SCP was separated from the solution using vacuum filtration. SCP was washed several times to get pH 7.0 and then dried using air drying for 1–3 days.
Distilled water (100 mL) in a beaker glass was added by Fe3O4-NPs with each concentration of 0.0wt% or control (SCPFe0), 10.0wt% (SCPFe10), 20.0wt% (SCPFe20), and 30wt% (CFe30), then sonicated at 20 kHz, 30 minutes. Each Fe3O4-NPs content was added by 5 g of dried SCP to form an SCP composite. The mixture was stirred for 30 minutes, and sonication was carried out to reduce agglomeration at 20kHz for 30 minutes. SCP composite was oven-dried at 60°C for 20 hours.
The crystallinity of the SCP composite was observed by XRD (X'pert Pro, Malvern Panalytical, Westborough, MA, USA). Powder samples were scanned using XRD at 2θ of 5°–90°, 30 mA and 40 kV, and a wavelength of 1.542 Å. Scherrer’s formula [Equation (1)] and Segal formula [Equation (2)] were used to calculate crystallite size (L) and crystalline index (CI), respectively (Yanuhar et al., 2022).
Where q was the angle of diffraction; b was FWHM (rad); l was the X-ray wavelength; K was 0.89 (Scherrer’s constant).
Where: I[002] is the maximum intensity of [002] lattice diffraction at about 22.0° and I[am] is the lowest intensity at about 18°.
Characterization of SCP composite included the analysis of functional group, morphology, and magnetic properties. The SCP composite functional groups were analyzed using FTIR (Prestige-21, Shimadzu, Kyoto, Japan). SCP composite was dried at 105°C for 3 h in the oven and then ground into powder. KBr powder 1.0 mg was mixed with SCP powder 0.1 mg and then pressed to form a pellet. The sample was scanned in the wavenumber ranging from 400 to 4,000 cm–1 at a rate of 2.0 cm–1. SCP composite powder morphology was observed under an SEM (Inspect S50, FEI, Tokyo, Japan) at 25 kV. A gold coating (SC7 620, Emitech, Chelmsford, UK) was applied to the SCP composite powder before being observed under SEM. VSM (PPMS-VersaLab, Quantum Design, San Diego, CA, USA) analysis was conducted on SCP powder samples with a minimum mass of 50 mg to observe magnetic properties. VSM applied a magnetic field from –3,000 Oe to 3,000 Oe at room temperature (25°C) to the sample. BET analysis (Micromeristic Instrument, Norcross, GA, USA) with nitrogen gas as an adsorbate medium was applied to the sample to obtain the specific surface area and porosity of the SCP composite. Before analysis, the sample was degassed at 105°C for 4 h. BET test was conducted at standard temperature and pressure (STP; 273.15 K and atmospheric pressure; 1.013 × 10⁵ Pa).
Three sample measurements of dye adsorption were conducted using a UV-VIS spectrophotometer (Thermo Fischer Scientific, Waltham, MA, USA). The standard solution was prepared by adding 100 mg of Methylene Blue into 1,000 mL of distilled water, resulting in 100 ppm of the main solution. Then, dilute this main solution to reduce the concentration to 4 ppm in 100 mL. Add the SCP composite (0.5 g) into the solution and stir for 30 min. The analysis's maximum wavelength was 662 nm, and the absorbance was used to calculate the amount of Methylene Blue left in the effluent after the adsorption process. The following equation [Equation (3)] can be used to calculate the percentage of dye removed (Rd) from polluted water:
Where Co and C are the dye concentrations before and after treatment (mg/L), respectively.
The results of dye removal were analyzed using one-way ANOVA with a significant level of 95%.
The kinetic adsorption of dye was modeled using two different kinetic models: pseudo-first-order and pseudo-second-order models expressed by Equations (4) and (5), respectively (Al-Harby et al., 2021).
Where qe and qt are the adsorption capacity at equilibrium time and time t (mg/g), respectively, K1 is the pseudo-first-order rate constant (1/min), and K2 is the pseudo-second-order constant [g/(mg. min)]; t is the time (min). For pseudo-first-order, the values of qe and K1 were determined from the intercept and the slope of the linear plot of Log (qe − qt) versus t. For the pseudo-second-order, qe and K2 were determined from the slope and intercept of the linear plot of t/q against t.
3. RESULTS and DISCUSSION
SCP is constructed of multiple cellulose chains, which are stabilized by van der Waals forces and hydrogen bonds (Zhang et al., 2019). Incorporating Fe3O4-NPs into SCP leads to the change in SCP color from yellowish to blackish powder formation of a powdered morphology, as illustrated in Figs. 1 and 2.

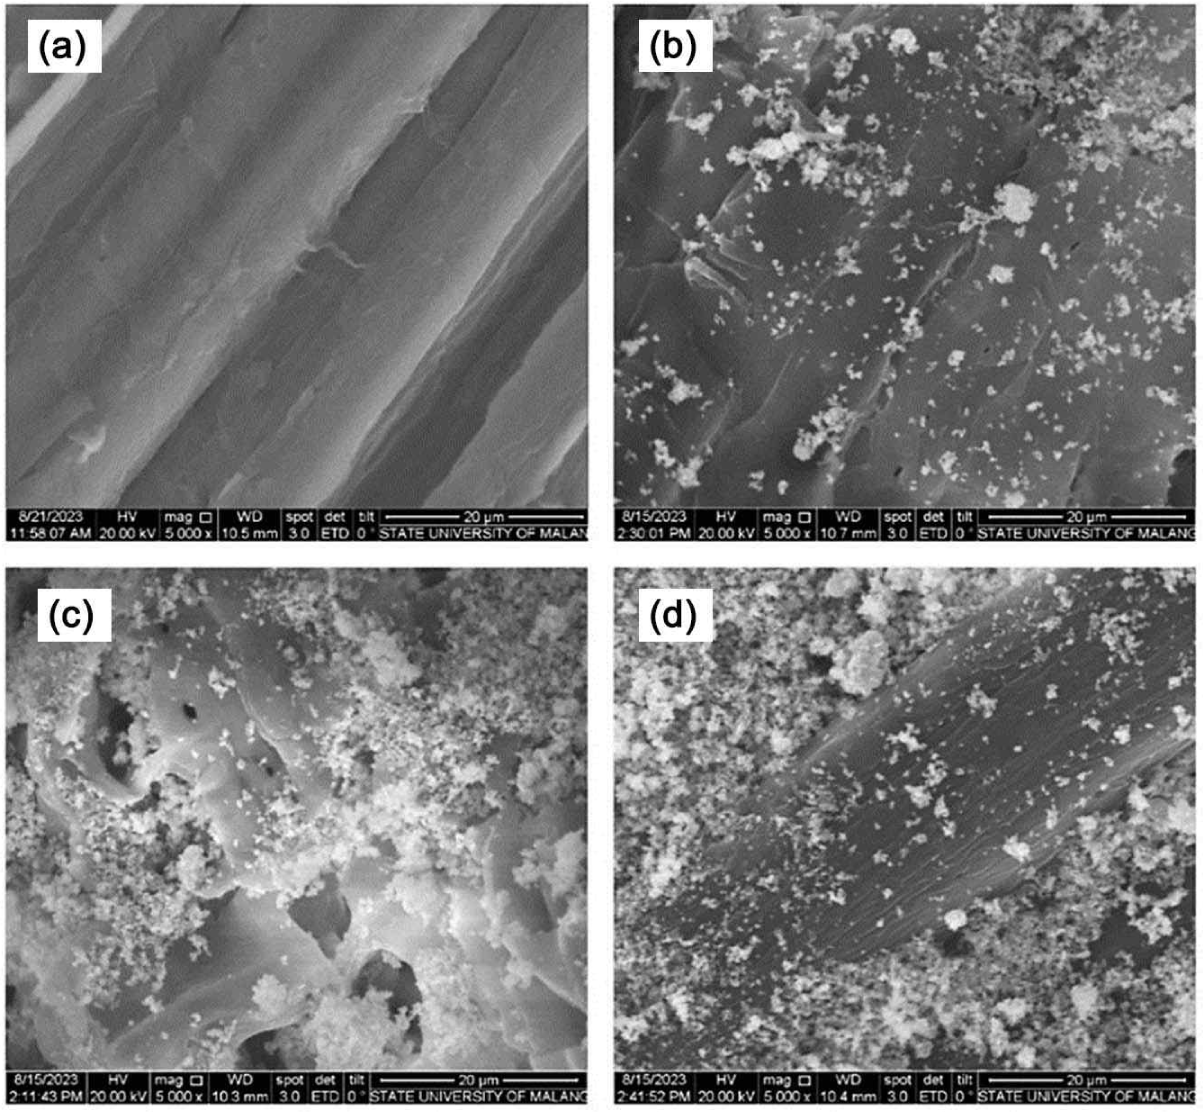
SCPFe0 shows a fiber structure with fiber walls and the lumen [Fig. 2(a)] with a smooth surface. After ex-situ nanoparticles, the SCP surfaces are successfully loaded on the Fe3O4-NPs [Fig. 1(b–d)]. SCPFe10 indicates several Fe3O4-NPs are deposited on the surface [Fig. 2(b)]. Fe3O4-NPs lead to agglomeration in SCPFe20, causing a rougher morphology [Fig. 2(c)]. The roughness of the SCP nanocomposite is derived from Fe3O4-NPs, and the rougher surface increases with the increasing Fe3O4-NPs content. This effect arises from the natural tendency of Fe3O4-NPs to adhere to nearby particles and form aggregates. Increasing Fe3O4-NPs content of 30.0wt% leads to more agglomeration on the surface SCPFe30 [Fig. 2(d)]. In addition to being applied onto the surface, the Fe3O4-NPs are combined with SCP, resulting in further clumping of the Fe3O4-NPs within the SCP. This phenomenon is a characteristic trait of nanoparticles that tend to agglomerate and form large-sized aggregates in aqueous medium strongly (Kędzierska et al., 2021). The magnetic properties of Fe3O4-NPs make them easier to agglomerate because of their high surface energy (Rahmawati et al., 2018). Furthermore, the Fe3O4-NPs display a favorable affinity with cellulose due to hydrogen bonding interactions (Zhang et al., 2019). However, a substantial interaction between the Fe3O4-NPs and cellulose can influence the overall morphology of the SCP.
Fig. 3 illustrates the diffraction peaks of the SCP nanocomposite. The SCP nanocomposite indicates a structure of cellulose Iβ with peaks at 15.1, 16.5, 22.8, and 34.4 corresponding to the lattice plane of [110], [1 ī0], [200], and [004], respectively (Lee et al., 2015; Nindiyasari et al., 2016). The presence of Fe3O4-NPs is indicated in SCP at 2θ of 30.5°, 35.6°, 43.2°, 53.6°, 57.1°, 62.7°, 71.1°, 74.1°, and 86.8°, correspond to the lattice plane of [220], [311], [400], [422], [511], [440], [620], and [622], respectively (JCPDS No. 19-0629). The diffraction peaks spanning the 2θ range of 10°–90° displayed marginal alterations, although the intensity of distinct diffraction peaks amplified as the Fe3O4-NPs content increased. The notable presence of Fe3O4-NPs in the SCP was discernible, presumably due to their accumulation on the SCP surface. Nonetheless, higher concentrations of Fe3O4-NPs increase the aggregation of nanoparticles, leading to a more evident crystalline quality. Those peaks were also observed with relatively low intensities in SCPFe10 and SCPFe20 samples. This indicated that the number of Fe3O4-NPs formed was greatest in the SCPFe30 sample. The cellulose arrangement becomes random due to the greater Fe3O4-NPs content, and the crystal value also decreases (Kiangkitiwan and Srikulkit, 2021).
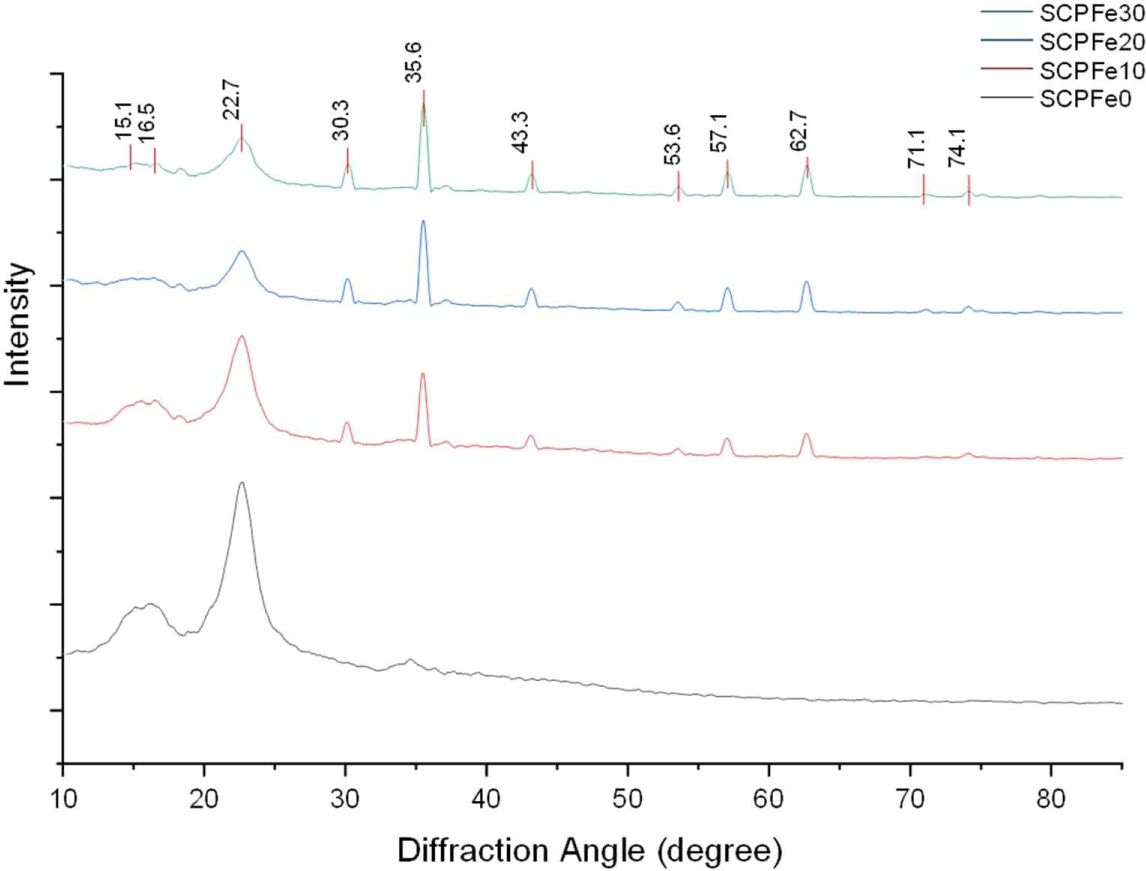
The CI value of SCPFe0 is 68.6% (Table 1). Fe3O4-NPs content of 10.0 wt%, 20.0 wt%, and 30.0 wt% reduces the CI value of 67.91%, 66.15%, and 63.58%, respectively. The crystallite size of the SCP composite is 12.18, 13.08, 15.35, and 15.75 nm for the SCPFe0, SCPFe10, SCPFe20, and SCPFe30, respectively. The introduction of Fe3O4-NPs resulted in a noticeable augmentation of the crystallite size, possibly due to the incorporation of Fe3O4-NPs into the SCP framework, which inherently possesses larger crystallites ranging from 9 to 53 nm (Upadhyay et al., 2016). The crystallinity of wood’s cellulose is influenced by rearrangement of the cellulose molecules in quasicrystalline region (Bhuiyan et al., 2000). In this case, higher content of Fe3O4-NPs might facilitate the damage of arrangement of cellulose molecule leading to a lower crystallinity index or the crystalline structure of SCP was damaged by magnetization (Dong et al., 2016). Contrastly, higher Fe3O4-NPs content influence to broadening of crystalline cellulose peaks and decreased in amplitude (Wotton et al., 2021) so crystallite size decreased.
The SCP composite underwent FTIR analysis, and the results of these tests are depicted in Fig. 4. IR transmittance spectrum was captured for SCPFe0, indicated by the black curve, as well as for varying content of Fe3O4-NPs functionalized SCP (10.0 wt%, 20.0 wt%, and 30.0 wt%). The analysis encompassed a wavenumber from 400 to 4,000 cm–1.
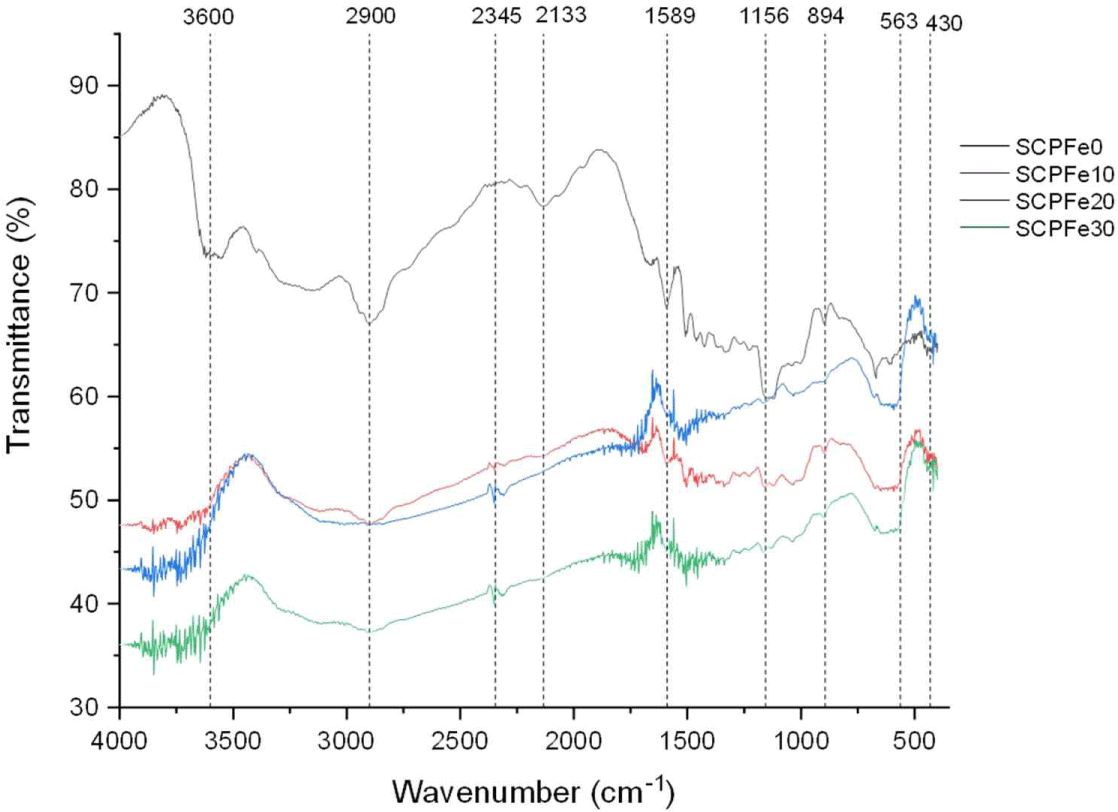
Comparing the IR spectrum of the SCP-Fe3O4-NPs reinforcement with the SCP, some peak changes were detected. Fig. 3 is a representation of the intermolecular bonding of the SCP-Fe3O4-NPs composite. According to Fig. 4, introducing Fe3O4-NPs into SCP leads to a displacement of the C-H and O-H stretching signals within wavenumber of 2,700–3,600 cm–1, originating from cellulose (Suryanto et al., 2019). The wide peak observed within the 3,300–3,600 cm–1 range corresponds to the vibrational stretching of OH groups, which plays a pivotal role in defining hydrogen bonding (Wiguna et al., 2023). Some changes occur at several points of the wavelength value. The O-H bond at 3,600 cm–1 disappears after adding Fe3O4-NPs. This suggests that the presence of Fe3O4-NPs alters the hydrophilicity properties of SCP. Besides that, at the point of 2,900 cm–1, which is a representation of the C-H bond, it also experiences valley loss. In wavenumber from 760 to 1,800 cm–1, the spectrum exhibits modes of organic groups (Lesiak et al., 2019). The cellulose peak within the wavenumber from 1,520 to 400 cm–1 exhibits broadening due to the flexing of functional groups like CH2, C-H, and C-O within the cellulose structure (Suciyati et al., 2021). At wave number 1,589 cm–1, the C = O double bond experienced a decrease in the transmittance value, indicating a reduced number of these bonds (Mitić et al., 2009). The wave numbers 1,156 cm–1 and 894 cm–1 also experience loss of transmittance peaks, which references the C-O-C bond. The emergence of new transmittance peaks at points 563 cm–1 and 430 cm–1 indicates the presence of Fe-O bonds (Kamakshi et al., 2019).
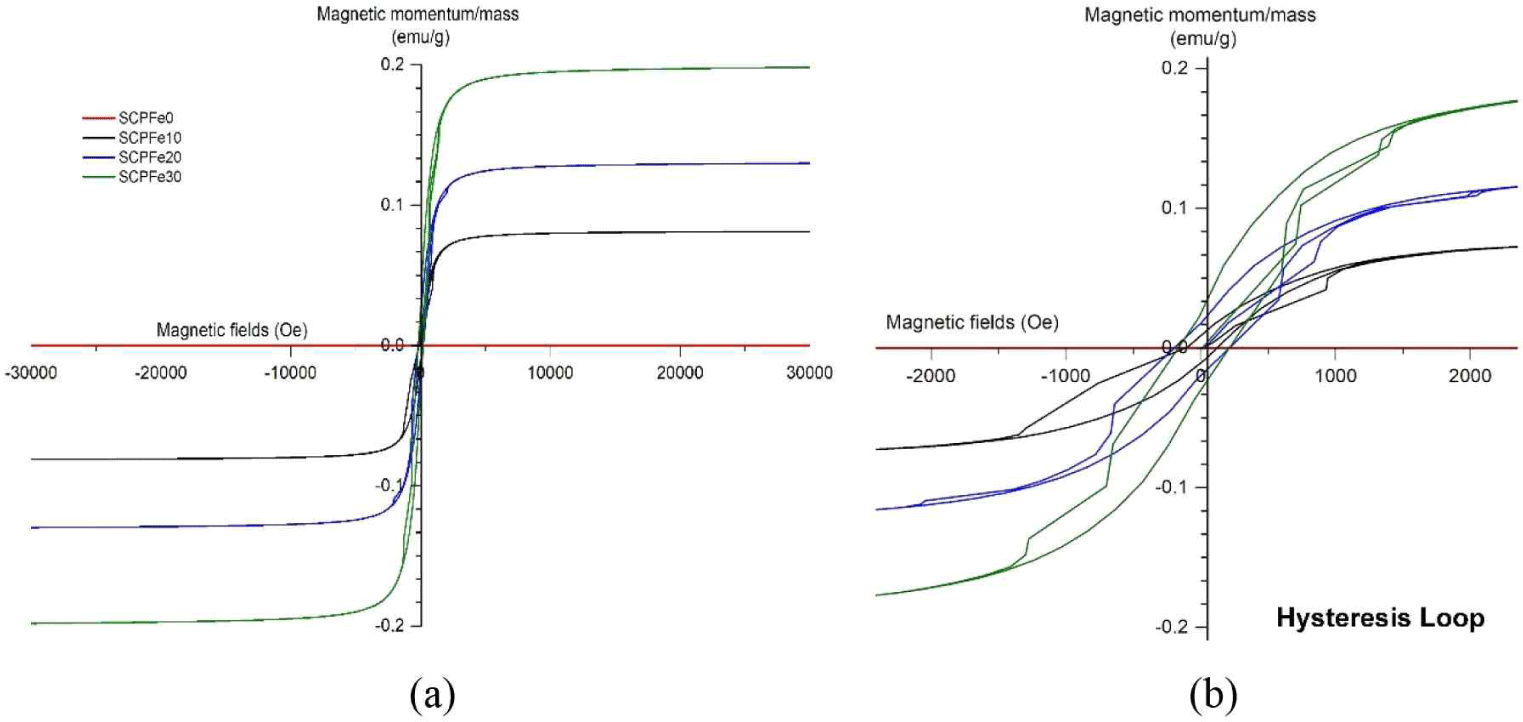
Different factors, including attributes like crystallinity, dimensions, morphology, and imperfections in the crystal lattice, play a substantial role in influencing magnetic attributes. Magnetic properties of SCP nanocomposite were identified using the hysteresis loops analysis between Magnetization (M) and applied field (H) using the VSM apparatus at room temperature. The hysteresis loops illustrating the SCP composite are presented in Fig. 5. The amount of such saturation magnetization (Ms), remanent magnetization (Mr), and magnetic coercivity (Mc) become the basis for the analysis of the magnetic properties of SCP nanocomposite, as shown in Fig. 5 and Table 2. The SCPFe0, as the control sample, has no hysteresis curve that indicates a diamagnetic material. After adding Fe3O4-NPs, the SCP composite indicates the magnetic properties shown by the small hysteresis curve. The small hysteresis curve suggests that magnetic cellulose possesses a superparamagnetic characteristic (Daoush, 2017). When subjected to an external magnetic field, the magnetic cellulose exhibiting superparamagnetic attributes can become magnetized and drawn toward the magnetic field. Nevertheless, the magnetization of the cellulose materials cannot be sustained once the external magnetic field is withdrawn (Sezer et al., 2021).
| Sample | Ms (emu/g) | Mr (emu/g) | Mc (Oe) |
|---|---|---|---|
| SCPFe0 | 0.00 | 0 | 0 |
| SCPFe10 | 0.01 | 0.063 | 99.40 |
| SCPFe20 | 0.02 | 0.114 | 87.50 |
| SCPFe30 | 0.04 | 0.175 | 239.16 |
Fig. 5(a) depict whole VSM graph of SCPFe composite and Fig. 5(b) is deconvulation of VSM graph that shows the small Mc of the SCP composite, which is nearly negligible, and the low Mr value (Table 2), indicating that the SCP composite shows paramagnetic characteristics. This property renders the material valuable for applications in nanotechnology and biomedical fields, including drug delivery systems (Palanisamy and Wang, 2019), magnetic separation techniques (Nithya et al., 2021), and scenarios in biomedicine that require controlled and reversible magnetic responses (Xiao and Du, 2020). The higher Fe3O4-NPs content, the higher Ms. SCPFe0, SCPFe10, SCPFe20, and SCPFe30 have Ms of 0.0, 0.01, 0.02, and 0.04 emu/g at 3,000 Oe (Table 2).
Compared to the other samples, SCPFe30 shows the largest energy dissipation rate, as seen from the hysteresis loop. This indicates that the SCPFe30 sample has the capacity to retain most of the saturated magnetic field even after the driving field is withdrawn (Usawattanakul et al., 2021). The increase in Ms is attributed to the existence of the Fe3O4 on the particle surface due to an effective modification reaction on the nanoparticles (Laksono et al., 2023; Movagharnezhad et al., 2022). The study conclusively indicates that increasing the content of magnetic material will enhance the magnetic properties of the composites for the intended application. Greater Ms values lead to increased magnetic induction within their surrounding area. This quality proves advantageous in magnetic separation processes, as it guarantees that the magnetic particles or isolated constituents are thoroughly magnetized and easily drawn toward the magnetic field. This enhancement in magnetic response subsequently improves the efficiency of the separation process.
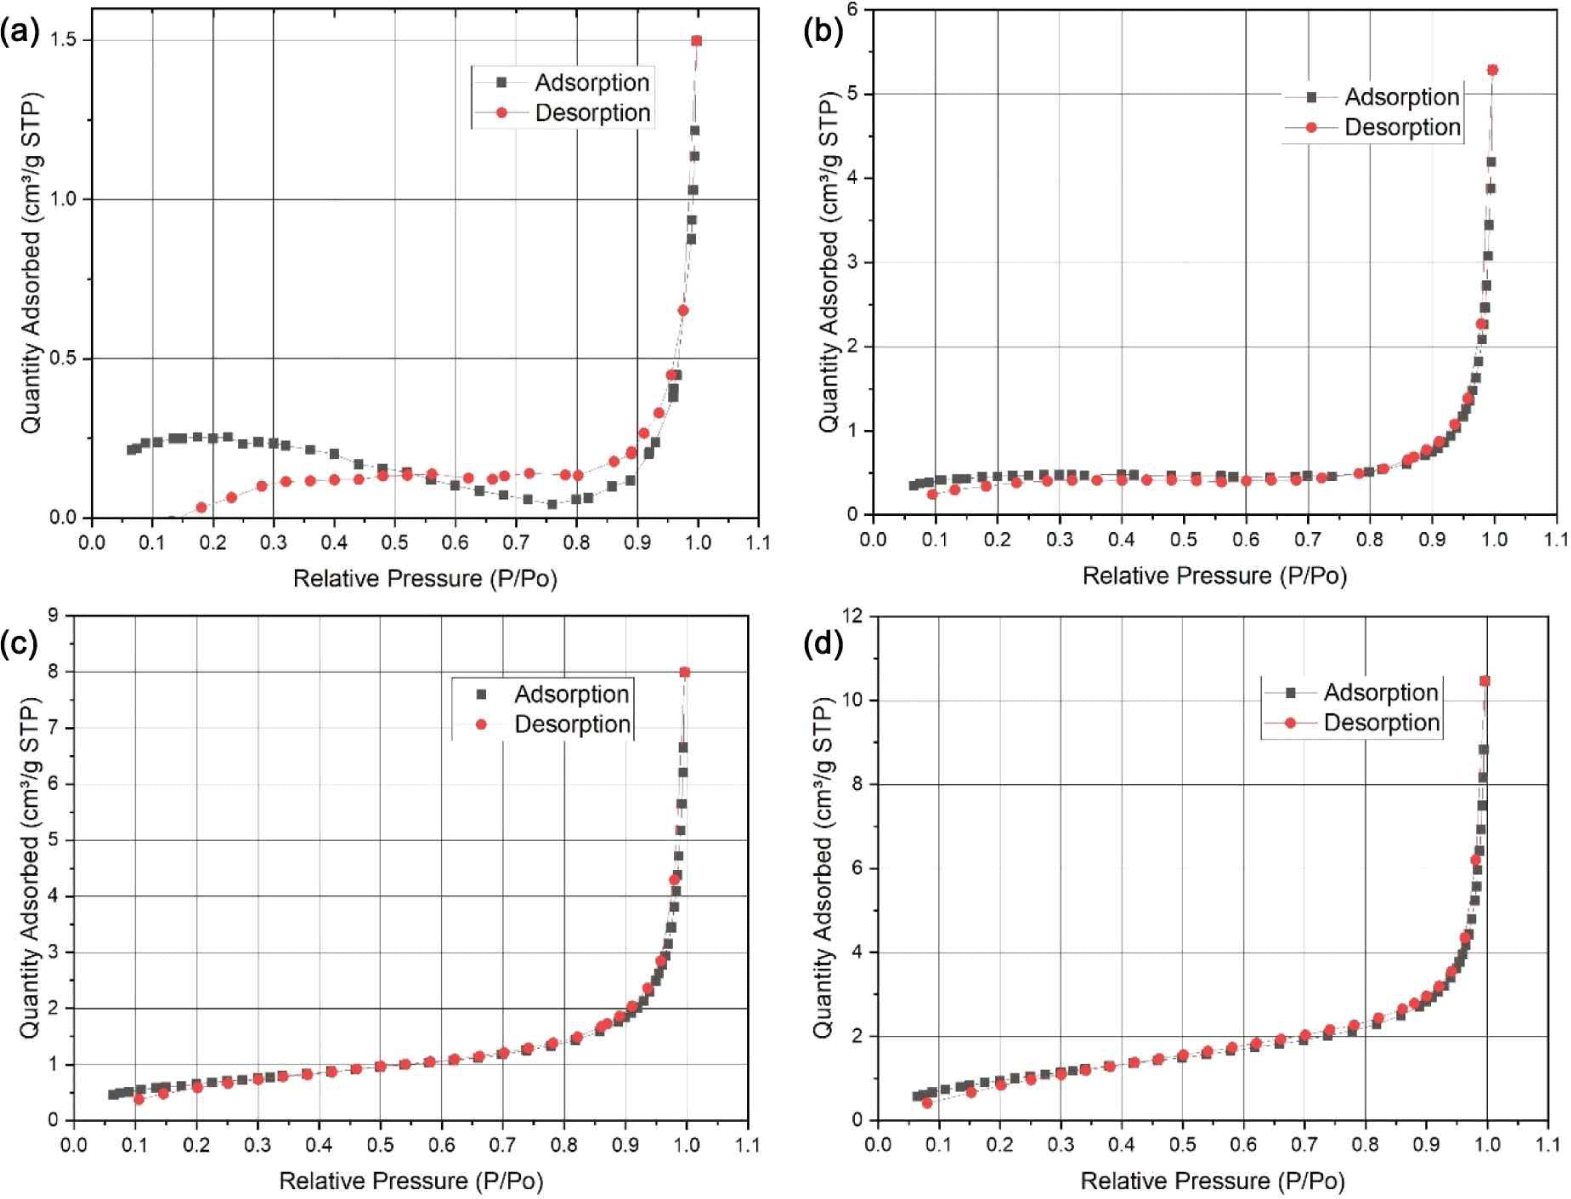
The BET analysis result of SCP composite using the adsorption of nitrogen is shown in Fig. 6, with no hysteresis loop in the sample, which indicates a homogenous surface. In all samples, the relative pressure (P/P0) is in the range from 0.1 to 1.0. The quantity of adsorbed nitrogen gas in SCP increases after adding Fe3O4-NPs which are 1.6618 cm3/g STP, 4.2363 cm3/g STP, 7.3649 cm3/g STP, 10.3347 cm3/g STP for SCPFe0, SCPFe10, SCPFe20, and SCPFe30, respectively. SCP with higher content of Fe3O4-NPs results in higher surface area with increasing BET surface area by about 310% from 0.9458 to 3.8853 m2/g for SCPFe0 to SCPFe30 (Table 3).
| Sample | Pore volume (mm3/g) | Pore diameter (nm) | BET surface area (m2/g) |
|---|---|---|---|
| SCPFe0 | 1,912 | 16.6695 | 0.9458 |
| SCPFe10 | 6,729 | 12.2163 | 1.5894 |
| SCPFe20 | 10,619 | 11.8957 | 2.4160 |
| SCPFe30 | 14,187 | 9.6080 | 3.8853 |
The pore size and surface area of BET analysis are given in Table 3. The pore size of SCP is under 20 nm. The higher content of Fe3O4-NPs, lower pore size, and higher pore volume. The pore sizes of SCP composite are 9.608–16.6695 nm and pore volume ranging from 1,912–14,187 mm3/g. This result is similar to the reported study that adding Fe3O4-NPs in the SCP can increase the surface area and porosity (Alizadeh and Rezaee, 2022; Tipsawat et al., 2018).
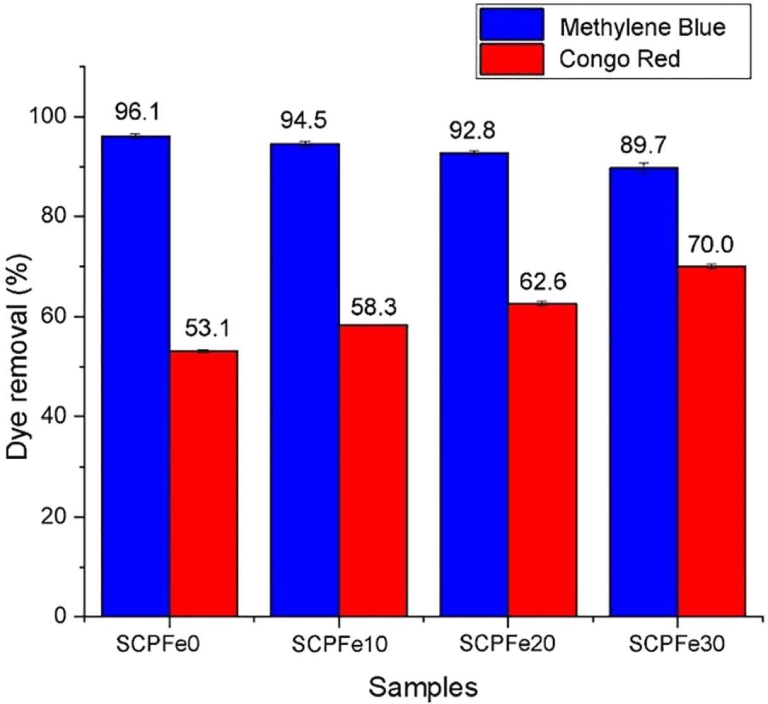
The result of calculating dye removal (Rd) using Equation (3) is shown in Fig. 7. Rd indicates that SCPFe0 adsorb the Methylene Blue from polluted water till 96.1 ± 0.43% (0.388 ± 0.0017 mg/g), and SCPFe10, SCPFe20, and SCPFe30 adsorb Methylene Blue till 94.5 ± 0.62% (0.382 ± 0.0024 mg/g), 92.8 ± 0.38% (0.373 ± 0.0014 mg/g), and 89.7 ± 0.98% (0.359 ± 0.0035 mg/g) or the adsorption capacity is reduced as much as 1.7%, 3.4%, and 6.7% compared to SCPFe0, respectively. This Methylene Blue adsorption is smaller than carbon produced from Sapwood waste, that achieve. Otherwise, the Rd of PCFe0 for Congo Red dye is 53.1 ± 0.21% (0.224 ± 0.0005 mg/g). The other samples, such as SCPFe10, SCPFe20, and SCPFe30, Rd of Congo Red dye by 58.3 ± 0.10% (0.246 ± 0.0003 mg/g), 62.6 ± 0.43% (0.264 ± 0.0011 mg/g), and 70.0 ± 0.43% (0.295 ± 0.0013 mg/g). The adsorption capacity increased for Congo Red dye adsorption by 9.8%, 17.9%, and 31.8% compared to SCPFe0. One-way ANOVA analysis with a significant level of 95% indicates that the concentration of Fe3O4-NPs in SCP significantly impacts the adsorption of Methylene Blue (Pvalue = 0.00) and Congo Red dye (Pvalue = 0.00).
The effect of magnetic nanoparticle content on the adsorption capacity is shown in Fig. 8. The kinetic evolution of the removal process of the dye by SCP composite was determined by experimental testing with time varying between 0 and 25 minutes, as depicted in Fig. 8. It was observed that the amount of dye adsorption increases with the contact time for all SCP composite samples. Until the contact time of 25 min, SCPFe30 and SCPFe10 have the highest amount of adsorption for Methylene Blue and Congo Red dye, respectively.
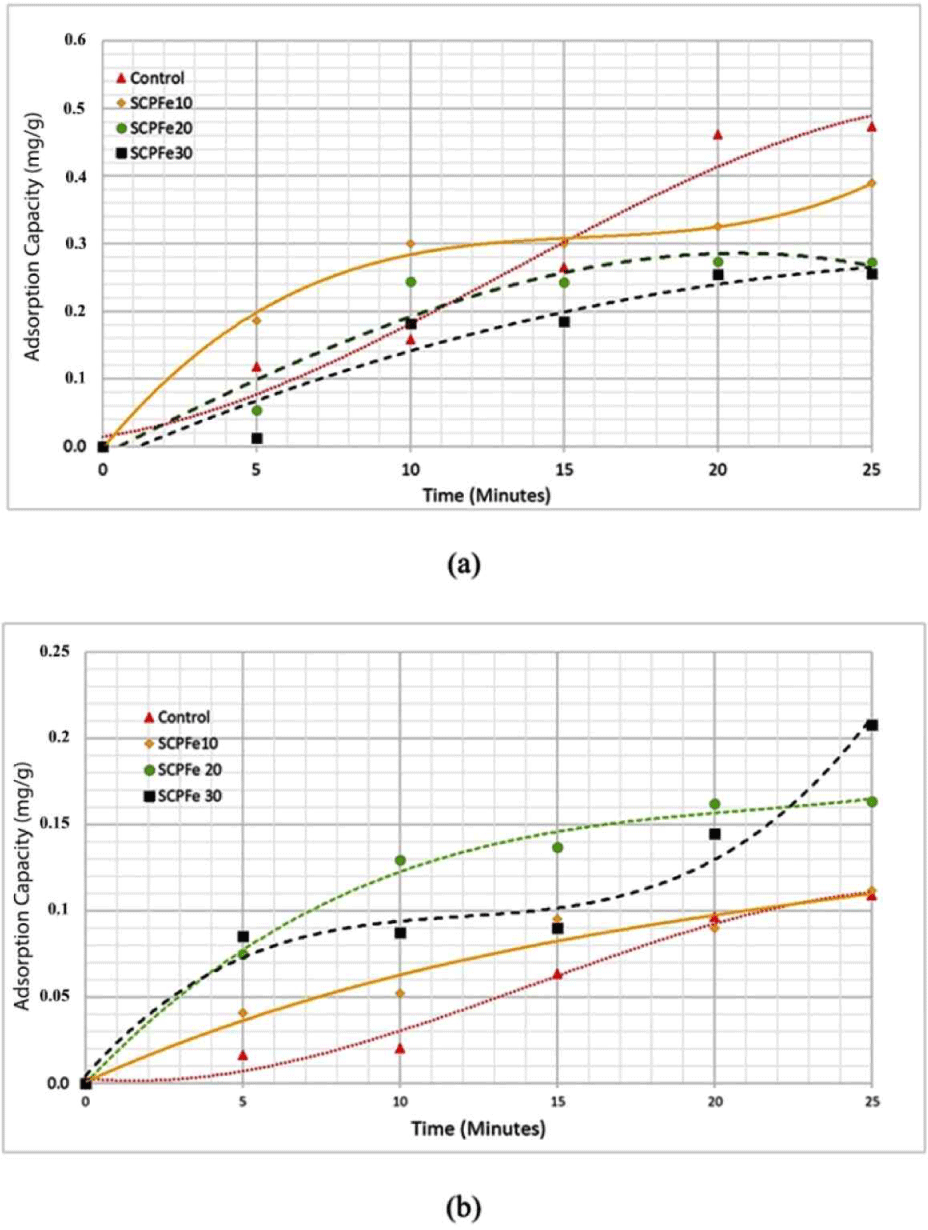
Fe3O4-NPs naturally possess hydroxyl groups on their surfaces because water dissociatively chemisorbs onto magnetite surfaces (Kendelewicz et al., 2000). Increasing Fe3O4-NPs content, enhance Fe3O4-NP interactions so the number of hydroxyl groups in the SPC was increased (Fig. 4). This hydroxyl group facilitates an effective dye absorption by SPC to anionic dye like Congo Red, due to electrostatic and hydrogen bonding interaction and between the adsorbent and dyes. Additionally, electrostatic forces between the surface of Fe3O4-NPs and SPC contribute to another form of intermolecular bonding. These electrostatic interactions are advantageous for dye adsorption (Talbot et al., 2021). Foroutan et al. (2021) reported that adding Fe3O4 in activated carbon causes increasing magnetic saturation and result in better adsorption capacity. Increasing the pore volume (Table 3) will generally increase the total capacity of adsorbent material to capture and store adsorbent substances. A larger pore volume provides a larger space to accommodate adsorbent molecules, thereby increasing the adsorption capacity per unit mass of adsorbent. The larger the surface area of an adsorbent, the higher its adsorption capacity, as it can accommodate a larger quantity of adsorbate (Lawtae and Tangsathitkulchai, 2021).
The plotting results of the adsorption using pseudo-first order and pseudo-second order kinetic models at different magnetic content are shown in Fig. 9. In the form of straight-line equations for each kinetic model, the kinetic constants can be determined for each adsorption model used.
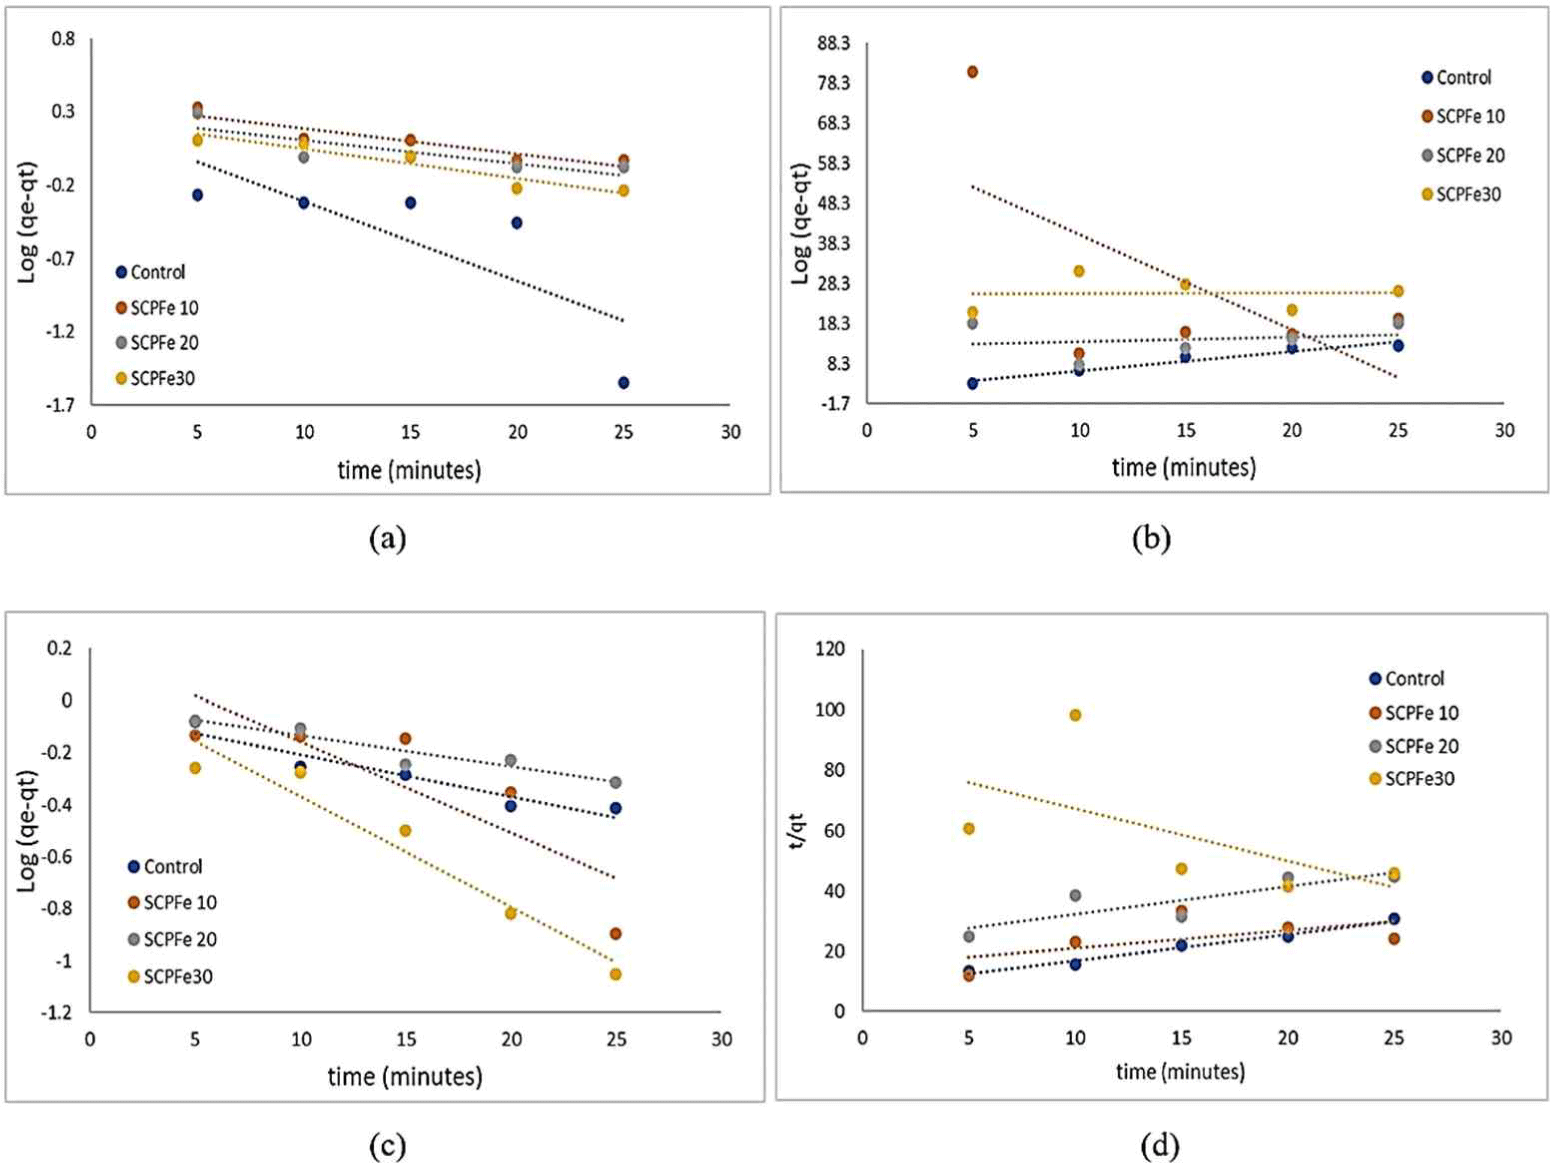
The results of kinetic data of the adsorption of Methylene Blue and Congo Red dye on SCP calculated using Equations (4) and (5) are tabulated in Table 4. The analysis of dye reaction kinetics at each concentration of Fe3O4-NPs shows that the adsorption process of Methylene Blue and Congo Red dyes in solution for each solution concentration has a different pattern. The Methylene Blue and Congo Red adsorption using the SPCFe adsorbent refers to a pseudo-first-order kinetic model instead of pseudo-second-order model because the correlation coefficient (R2) obtained for the first order is between 0.6981–0.9094 and 0.7065–0.9402 for Methylene Blue and Congo Red dyes, respectively, while R2 for second order has an extensive range between 0.0006–0.9478 and 0.3441–0.9772 for Methylene Blue and Congo Red dyes, respectively. The low value of R2 in pseudo-second-order model indicate that this model is not fit with kinetic model in adsorption of SPC with functionalized by Fe3O4-NPs. The pseudo-first-order kinetic model appears to be the better fit for both Methylene Blue and Congo Red adsorption. It suggests that the pseudo-first-order model is more robust and reliable in describing the adsorption kinetics with SPCFe adsorbent. This model indicate that adsorption occurs only physically without any chemical adsorption tendency (Khamizov, 2020). By increasing Fe3O4-NPs, the amount of adsorption increased for the anionic dye type (Congo Red) and decreased for the cationic dye type [Methylene Blue; Fig. 8(a) and (b)]. It indicates that only physical interaction resulted from the electrostatic force between the positive charge of Fe3O4-NPs surface and a negative charge from anionic dyes. It is supported by the calculation of a pseudo-first-order model of dye adsorption (Table 4).
| Dye | Samples | Pseudo first order | Pseudo second order | Ref. | ||||
|---|---|---|---|---|---|---|---|---|
| qe (mg/g) | K1 (1/min) | R2 | qe (mg/g) | K2 (g/mg/min) | R2 | |||
| Methylene Blue | Control | 1.9763 | 0.1244 | 0.9054 | 2.0567 | 2.386 | 0.9478 | This study |
| SCPFe 10 | 0.1926 | 0.0806 | 0.7065 | 0.4218 | 0.0027 | 0.4045 | ||
| SCPFe 20 | 2.2085 | 0.0366 | 0.6981 | 8.3263 | 5.5031 | 0.0483 | ||
| SCPFe 30 | 1.5308 | 0.0458 | 0.9094 | 71.4285 | 199.579 | 0.0006 | ||
| Congo Red | Control | 1.2044 | 0.0375 | 0.9054 | 1.1470 | 0.1621 | 0.9772 | This study |
| SCPFe 10 | 1.1664 | 0.0806 | 0.7065 | 1.7027 | 0.3572 | 0.3431 | ||
| SCPFe 20 | 1.0459 | 0.0274 | 0.8947 | 1.0800 | 0.1437 | 0.7130 | ||
| SCPFe 30 | 0.6339 | 0.0981 | 0.9402 | 0.5766 | 0.0410 | 0.3441 | ||
| Crystal Violet | Biochar | 14.9 | 0.044 | 0.817 | 16.4 | 0.00321 | 0.884 | Kyi et al. (2020) |
| Methylene Blue | Rice husk | 17.1038 | 0.028 | 0.9848 | 18.1906 | 0.0026 | 0.9641 | Quansah et al. (2020) |
| Methylene Blue | Annona squmosa seed | 3.5859 | 0.037 | 0.927 | 4.2937 | 0.00113 | 0.9889 | Santhi et al. (2016) |
| Acid Yellow 29 | Ailanthus altissima sawdust | 9.467 | −5 × 10⁻⁶ | 0.9974 | 0.00179 | 121,876 | 0.9999 | Rahman et al. (2021) |
Those materials (cellulose and its magnetic cellulose adsorbent) had different characteristics that could be used in the dye adsorption. The SCP has the ability to adsorb cationic dye types such as Methylene Blue easily because SCP contains hydroxyl groups that are scattered in the whole molecule (Oh and Park, 2022). The cationic dye-cellulose interaction occurs through hydrogen bonding and intermolecular Van der Waals forces (Akter et al., 2021). Adding magnetic nanoparticles reduces cationic dye adsorption caused by reducing hydrophilic properties of SCP after interaction with magnetic nanoparticles. Different results were shown by anionic dyes like Congo Red. Anionic dyes have a repulsion to the hydroxyl group in SCP, but after the addition of magnetic nanoparticles, Congo Red adsorption increases up to 31.8% (Yu et al., 2014). It is caused by magnetic nanoparticles having a positive charge at a neutral aqueous solution, so they easily interact with Conge Red dye as anionic dye, so Congo Red adsorption increases after adding Fe3O4-NPs into SCP.
4. CONCLUSIONS
The effect of Fe3O4-NPs on sawdust waste was examined. The SCP's surface structure revealed that Fe3O4-NPs were deposited and distributed throughout. A larger concentration of Fe3O4-NPs resulted in agglomerates on the surface. The analysis of functional groups at specified wavenumbers (1,156 cm–1 to 1,589 cm–1) revealed an interaction between SCP and Fe3O4-NPs. The addition of Fe3O4-NPs caused a modest drop in the nanocomposite’s CI. Interestingly, SCP’s crystal size rose from 12.18 to 15.75 nm. BET research revealed that the SCP composite had a mesoporous surface, with pore sizes ranging from 9.6080 to 16.6695 nm. The introduction of Fe3O4-NPs into the SCP resulted in significant modifications to its magnetic characteristics. Specifically, the SCP, which was previously diamagnetic, changed to a magnetic state with superparamagnetic properties, as demonstrated by a modest hysteresis curve in VSM analysis. Adding magnetic nanoparticles boosted their ability to adsorb anionic dyes such as Congo Red by up to 31.8%, and the adsorption of SCP composite for Methylene Blue and Congo Red dye tends to follow a pseudo-first-order adsorption kinetics model. In the future, SCP enhanced with magnetic nanoparticles may be used as a dye adsorbent for wastewater treatment.


