1. INTRODUCTION
Timber-framed construction (TFC) is more environmentally friendly than mineral-based building materials because it is obtained from a sustainable and renewable resource called timber, and its high strength-to-weight ratio limits the total mass of the building, making it earthquake-resistant. These benefits have led to a resurgence in popularity over the past few years (Izzi et al., 2018; Kim et al., 2014). In line with this trend, research on various TFC is being actively conducted in Korea, including materials such as plywood (Choi et al., 2021), parallel strand lumber (Oh, 2022), nail laminated timber (Hwang et al., 2022), cross laminated timber (Choi et al., 2020; Fujimoto et al., 2021; Song and Kim, 2023; Yang et al., 2021), and Yellow Residual Soil (Ha et al., 2023), as well as floor impact sound insulation performance. TFC is a type of residential construction commonly used in North America, Europe, and Japan due to its aesthetic and constructability (Cao et al., 2020; Kim et al., 2012). TFC is a widely applied system in residential houses. It has excellent seismic performance and multiple load paths due to its redundancy and ductility but suffers from the disadvantages of wood such as poor perpendicular-to-grain tensile strength and brittle failure in bending. As a result, it faces its limitations as a high-rise wooden structure building (Cao et al., 2021). As one way to solve these problems, wood wood-concrete hybrid structures offer a potential solution that is more competitive and effective (Hashemi et al., 2021; Kreis et al., 2023).
The use of reinforced concrete (RC) slabs, i.e. timber beams/joists or plates with timber concrete composite (TCC) floors/decks, has increased rapidly over the past few decades (Hammad et al., 2024). Since the design of TCC composite structures is often determined by the limits of deflection, deformation is greatly influenced by the time-dependent behavior of the components, i.e. shrinkage of the wood and concrete and creep of the connections (Schänzlin and Fragiacomo, 2018). Therefore, much research has been devoted to the development and structural evaluation of TCC systems subjected to short-term static, cyclic and dynamic loads (Cao et al., 2021; Fragiacomo and Lukaszewska, 2013; Khorsandnia et al., 2014).
This study conducted an experiment on the amount of deformation of flooring using TCC in western Japan. Kama-city Inatsuki-higashi compulsory education school in Fukuoka Prefecture was selected as the target area and building. In RC buildings, the floor form is replaced with wood and used as an interior material instead of being removed after curing. At this time, the vibration performance (EI) of the wood reduces the amount of deflection of the concrete and controls the amount of deformation. Through this, the thickness of the flooring concrete is thinned to reduce floor load and the weight of the building, and reduce construction costs by reducing the amount of concrete used. The creep amount over time of TCC floor is measured for 5 weeks to predict the amount of deformation after 50 years and confirm its potential as a structural material.
The remainder of this paper is organized as follows. Chapter 2 explained the overall experimental settings and measurement methods for TCC flooring. Chapter 3 presents the results of a 5-week creep experiment and the predicted 50-year change. Finally, Chapter 4 presents a brief summary and conclusion.
2. MATERIALS and METHODS
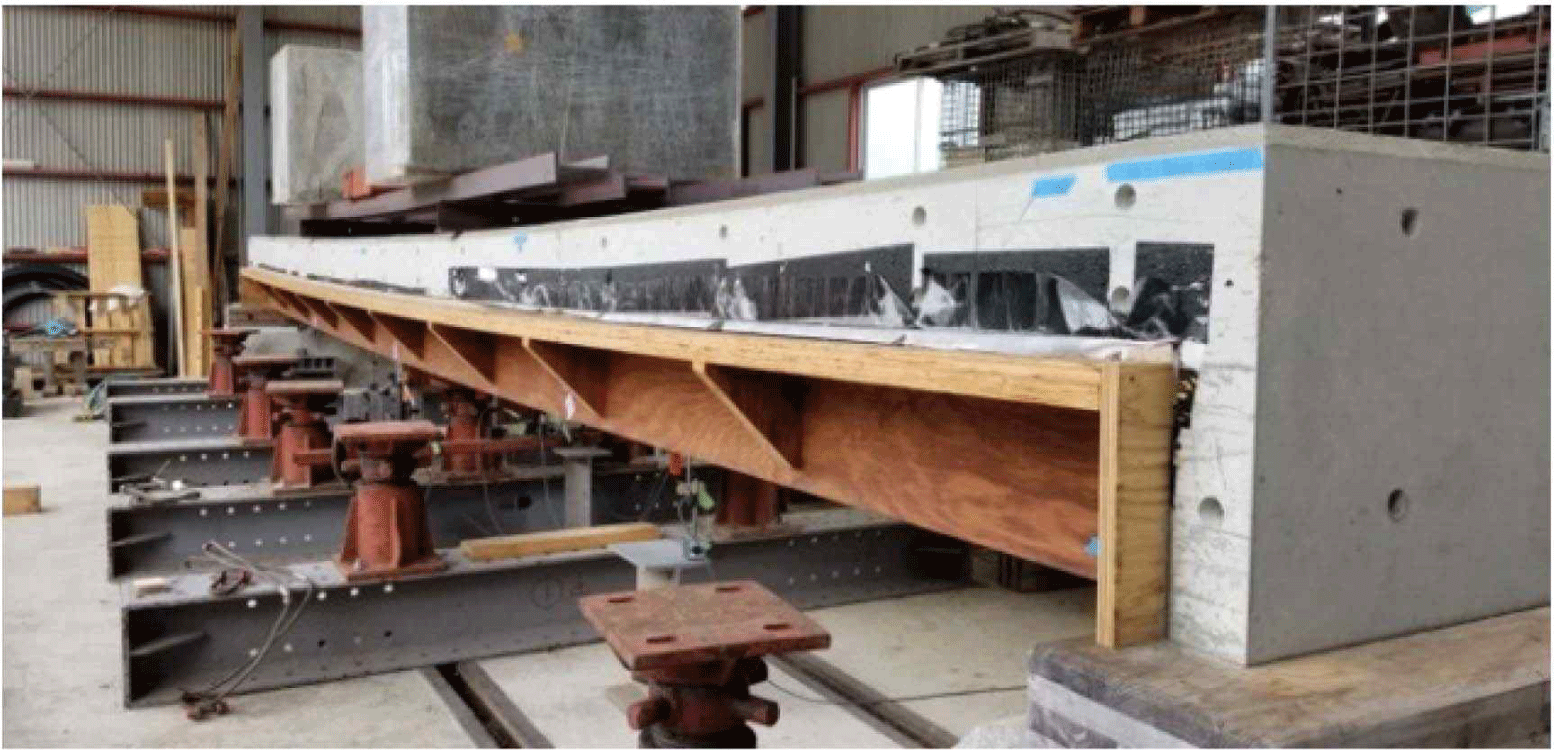
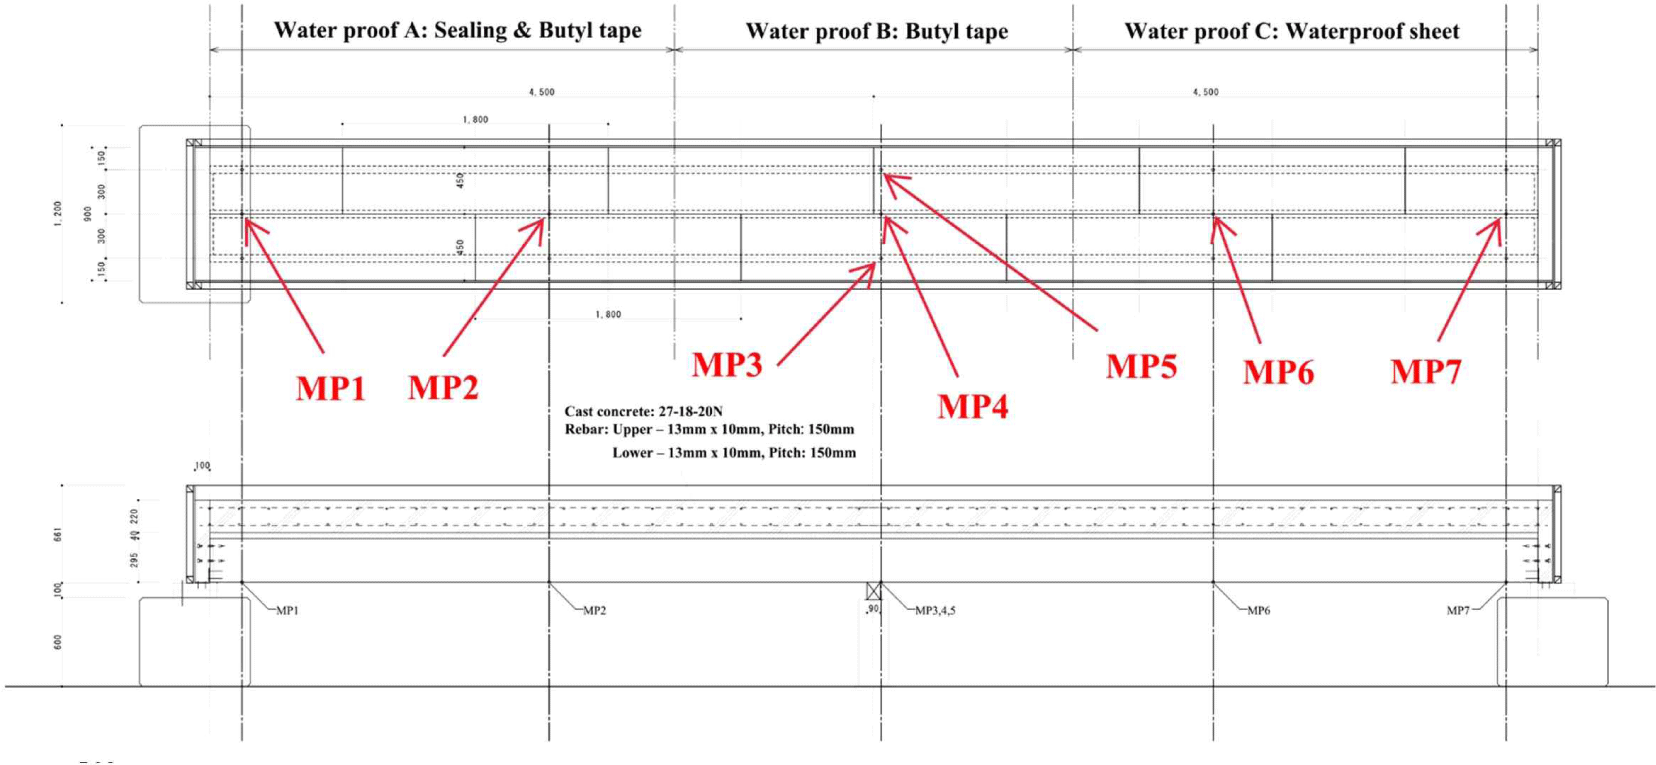
It is generally known that if stress is continuously applied to wood, the strain or deflection will increase over time because it is a viscoelastic material. This phenomenon is called creep, and clarifying its behavior is important from a safety perspective. The laminated veneer lumber (LVL) used in this creep test is Larix sibirica, with a moisture content (MC) of less than 8% and an average density of 0.65. The specifications of the LVL formwork used in this creep test are 9,000 mm in length and 900 mm in width. Dividing the formwork into three parts: 1. sealing and waterproof tape, 2. waterproof tape only, 3. waterproof sheeting was applied every 3,000 mm. Concrete was placed on top of the LVL. Fig. 1 shows the pictures of the test specimen and data logger. Fig. 2 is a sketch of the test specimen, and the dots indicated by arrows are measurement points (MPs). Measurements were taken at 7 locations, numbered MP1 to MP7 from the left of the drawing. The test specimen was supported by shoring for 17 days from the start of the test. Then, the creep test period was 21 days, including the day the shoring was removed, and the deflection of the LVL was measured using only the weight of the concrete. The deformation amount due to creep was measured at the seven locations shown in Fig. 2, and temperature and humidity were also measured.
The experimental location is Hiroshima Prefecture, Japan. The test period was from July 1st to August 20th, 2021, and the variation meter used to measure the amount of deformation was SDP50, manufactured by Tokyo Sokki (Tokyo, Japan). The average temperature during the creep test period was 27.8°C and average humidity was 65.3%, the SD was 4.5°C and 18.6%, respectively, and the equilibrium moisture content (EMC) was 10%.
The creep coefficient is defined as the increase in deflection relative to the initial deflection (Chiniforush et al., 2021), although the method of creep analysis differs depending on the country. In the case of Japan, the following procedures are stipulated by the performance evaluation method for building materials stipulated in the technical standards related to Article 37 of the Standards Act (Ministry of Construction Notification No. 1,446 of 2,000; Ministry of Land, Infrastructure, Transport and Tourism, 2016):
-
Calculate the ratio of the amount of deflection one minute after loading δ0 to the amount of deflection δt at elapsed time t, and use it as the creep deflection ratio Kt. Measurements are taken 1 minute, 5 minutes, 10 minutes, 100 minutes, and 500 minutes after loading and every 24 hours for over 5 weeks. The intercept and slope of the regression line are calculated for the relationship between the common logarithm log10Kt of the creep deflection ratio and the common logarithm log10t of elapsed time.
-
Find the creep deflection ratio K50yr, whose value is 50 years on the regression line, as the creep adjustment coefficient.
Since the creep deflection ratio cannot be observed, it must be estimated based on a regression equation. Following the method above, based on the data measured during the experiment period, a linear simple regression is performed using the common logarithm of elapsed time log10t as an explanatory variable and the common logarithm of creep deflection ratio log10Kt as an objective variable. The regression equation is expressed as follows.
Where Kt is creep deflection ratio after t minutes, δ1min (mm) is deflection after 1 minute, δtmin (mm) is deflection after t minutes, α is the intercept of the regression line between log10Kt and log10t, β is the slope of the regression line, εi is the error term of each observed data. The range of observed data for regression analysis was set to t > 10. Then, based on the regression equation, the creep coefficient K50yr is estimated using the following equation.
Here, it should be noted that if 50 years are converted to seconds, the value.
3. RESULTS and DISCUSSION
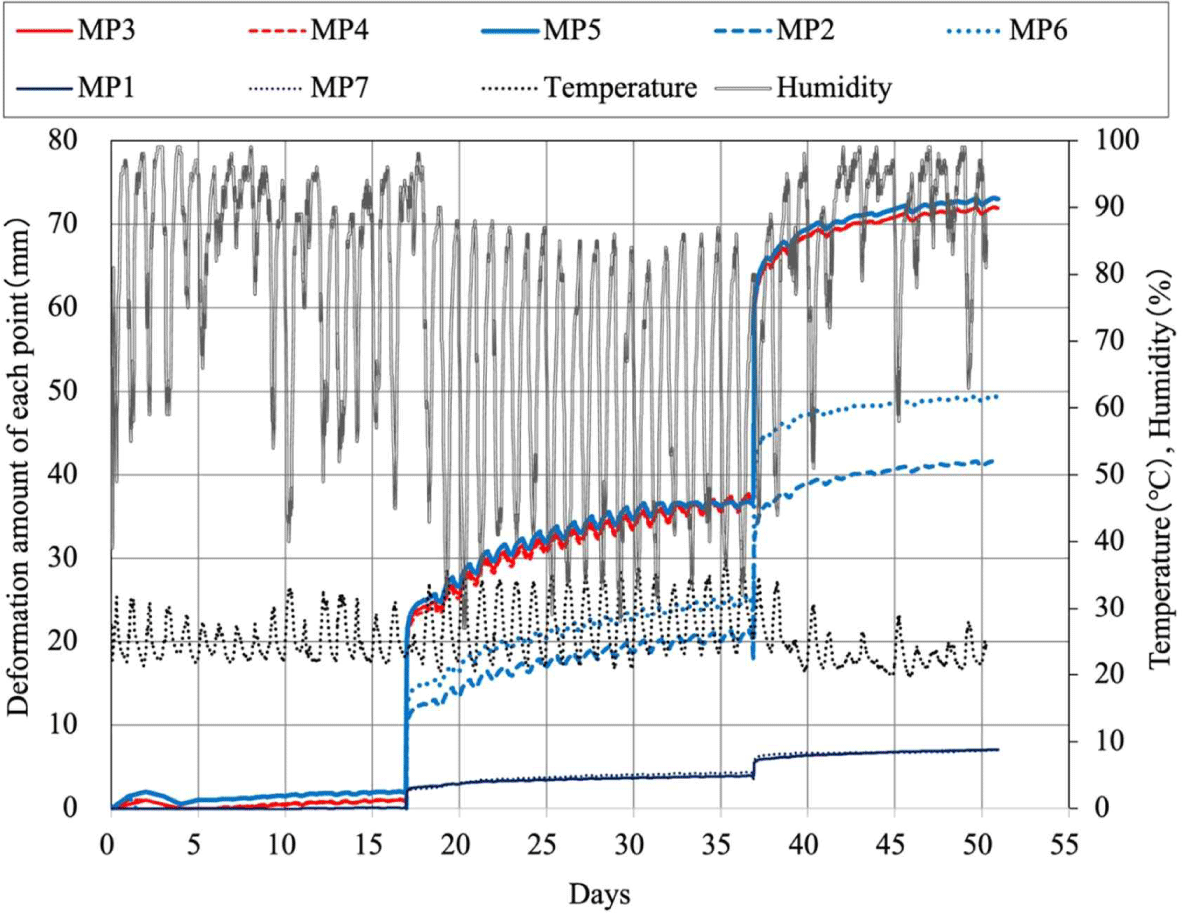
Fig. 3 shows the amount of deformation and changes in temperature and humidity at each MP. Immediately after the start of the project, no creep is observed due to shoring. There are two times when the amount of deformation changes significantly, which correspond to the beginning of the first creep period and the second creep period, respectively. The analysis results of the creep test period are summarized in Table 1. R is the correlation coefficient between both variables subjected to regression, and R2 is the coefficient of determination. High coefficients of determination were obtained at all MPs. Also listed is the ratio between the amount of deformation after 1 minute, δ1min, and the estimated amount of deformation after 50 years, δ50yr. This is the reciprocal of K50yr and is the deformation increase coefficient. At the central part, the deformation increase coefficient was close to 3. In summer creep tests in western Japan, the amount of deformation tends to increase, and the value of δ_50yr estimated by regression is expected to be larger than reality.

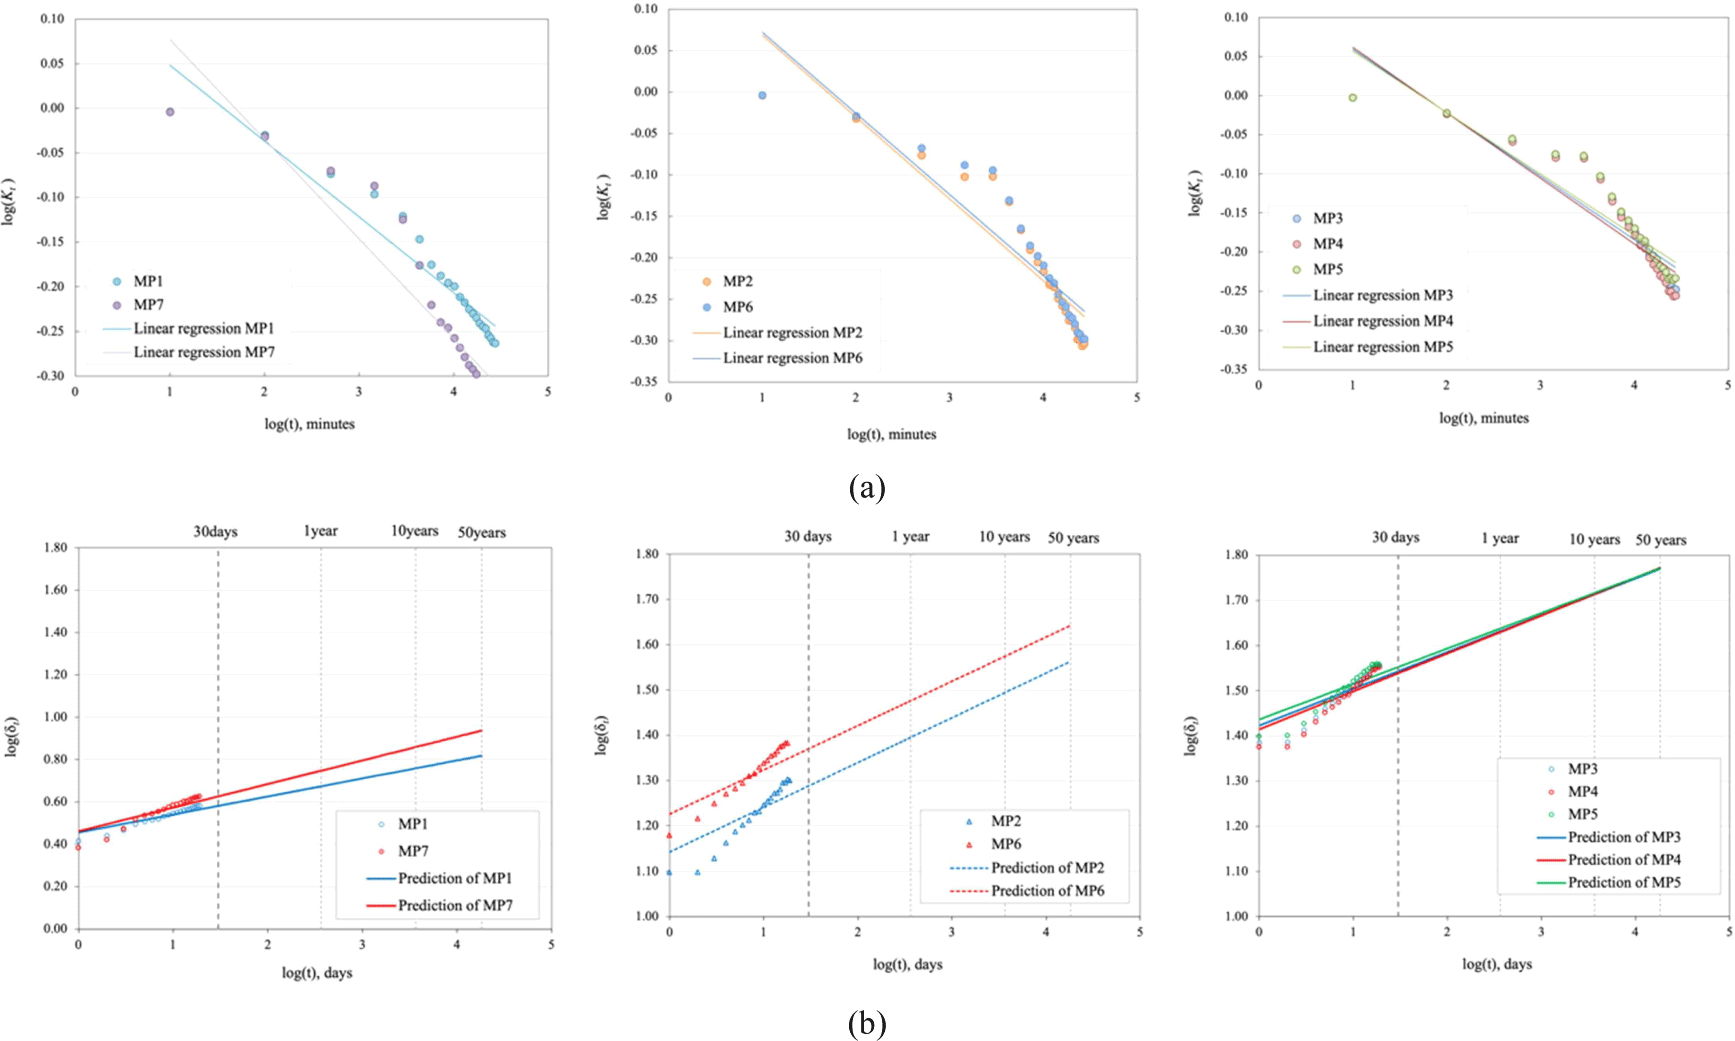
Fig. 4(a) shows a scatter plot and regression equation of the creep deflection ratio and elapsed time during the test period. Fig. 4(b) shows the predicted amount of deformation up to 50 years from the regression equation. At all MPs, as time passes from the start of the test, the ratio of the amount of deformation to the change over time gradually increases. These results suggest that the weight of the concrete placed may have been excessive compared to the load capacity of the LVL formwork.

From the above results, with the specifications of the LVL formwork this time, the deformation and the subsequent creep rate of change were large after the shoring was removed. To ensure safety, structural reinforcement of the tension side of the formwork is considered necessary.
4. CONCLUSIONS
This study focuses on the creep behavior of TCC flooring in Hiroshima Prefecture, Japan. The experiment was conducted at Kama-city Inatsuki-higashi compulsory education school in Fukuoka Prefecture to evaluate the deformation over time and predict long-term performance. TCC systems combine timber beams or joists with RC slabs, providing benefits like reduced floor load, weight, and construction costs. The study used LVL formwork made from L. sibirica, with measurements taken from July 1st to August 20th, 2021. The LVL formwork specifications included 9,000 mm in length and 900 mm in width, divided into three parts with different waterproofing treatments. Concrete was placed atop the LVL, and deformation due to creep was measured at seven locations (MP1 to MP7) using an SDP50 variation meter. The creep test period lasted 21 days, with measurements taken at specific intervals and averaged temperature and humidity recorded at 27.8°C and 65.3%, respectively. Results indicated no significant creep during the initial period due to shoring. Significant changes in deformation were observed at the beginning of each creep period. High coefficients of determination were obtained at all MPs, with the central part showing a deformation increase coefficient close to 3. Scatter plots and regression equations revealed an increasing ratio of deformation over time, suggesting that the concrete load may have exceeded the LVL formwork’s capacity. The experiment highlighted the need for structural reinforcement of the formwork’s tension side to ensure safety. While the initial creep rate of change was significant, it decreased during the second period, indicating high resistance to additional loads post-construction. Overall, the results emphasize the importance of considering long-term deformation in TCC flooring design and suggest that while current specifications show promise, enhancements are necessary for improved performance and safety.
A future challenge is to extend the test period. This increases the validity of regression analysis and eliminates seasonality. A possible way to obtain more accurate results is to extend the test period to improve the validity of regression analysis and eliminate seasonality. The unique climate of western Japan may have influenced the results of this test. To support the spread of wooden hybrid systems in the field, it is hoped that experimental data will be accumulated regarding creep under more general conditions. Although it is desirable to utilize wood materials in a decarbonized society, it would be advantageous for the introduction of LVL to conduct creep tests under various conditions and verify safety.


