1. INTRODUCTION
Advances in timber engineering and prefabrication systems have resulted in the development of mass timber and hence an increase in the number of timber structures (Ahn et al., 2021; Choi et al., 2020, 2021; Eversmann et al., 2017; Fujimoto et al., 2021; Galih et al., 2020; Harte, 2017; Hendrik et al., 2019; Jung et al., 2020; Kremer and Symmons, 2015; Lee et al., 2022; Park et al., 2020; Song and Kim, 2022; Yang et al., 2021). Developing and utilizing novel wood-based structural materials is a practical strategy for realizing the global challenge, “Net Zero by 2050” (Bouckaert et al., 2021). Wood is composed of carbon captured from the atmosphere via photosynthesis during tree growth (De Araujo et al., 2020). Additionally, wood manufacturing consumes less fossil fuel than metal, concrete, and plastic products (Bergman et al., 2014). Hence, using wood products reduces carbon emission. The “Wood First Act” (British Columbia, 2009) enacted in British Columbia, Canada, and “The Act for Promotion of Use of Wood in Public Buildings” (Japanese Ministry of Agriculture, Forestry, and Fisheries, 2010) enacted in Japan are policies that aim to achieve carbon neutrality by revitalizing the wood industry.
Wood is a hygroscopic material that shrinks and swells repeatedly in response to changes in the surrounding climate (Chang et al., 2019; Liu et al., 2022; Park and Jo, 2020). Hence, an accurate evaluation of moisture fluctuations caused by changes in ambient air and the consequent dimensional changes must be performed to secure the structural stability of timber structures. Dimensional changes owing to frequent moisture fluctuations cause structural failure in timber structures (Dietsch and Winter, 2018; Franke et al., 2015). In addition, damp conditions involving more than 20% moisture content (MC) increase the biodegradation risk of wooden materials (Bobadilha et al., 2020; Kirker et al., 2016; Sinha et al., 2020; Wang et al., 2018). Because moisture in wood is a critical factor in determining the stability and lifespan of timber structures, one should perform an accurate diagnosis of moisture changes in wood through monitoring.
Various indirect methods for measuring wood moisture have been reported, such as electrical resistance, radio frequency, and near-infrared spectroscopy (Chang et al., 2015; Forsén and Tarvainen, 2000; Nursultanov et al., 2017; Reci et al., 2016; Yang et al., 2015). Among them, electrical resistance methods are preferred for moisture monitoring in timber structures (Björngrim et al., 2016; Brischke et al., 2008; Dietsch et al., 2015a). A four-point probe method based on electrical resistivity has been proposed to compensate for the limitations of electrical resistance affected by the dimensions of a material (Hafsa et al., 2021; Hwang et al., 2021). Electrical resistance- and resistivity-based methods should account for the tree species, preservatives, stress conditions inside wood due to structural loads, and unstable electrode contacts.
At a specific temperature, wood moisture reaches equilibrium with the surrounding relative humidity (RH), which is known as the equilibrium moisture content (EMC). The sorption equation describes the relationship among the temperature, RH, and EMC (Hailwood and Horrobin, 1946). The large specific surface area of wood allows equilibrium to be attained between the ambient RH and wood moisture rapidly (Mahnert and Hundhausen, 2018). This characteristic renders hygrometric sensors appropriate for monitoring applications (Franke et al., 2013).
In this study, the moisture and dimensional changes of a nail-laminated timber (NLT)–plywood composite, which is the base layer for an NLT–concrete hybrid slab developed for effective floor structures, are investigated. NLT, which is used in floors, roofs, shafts, walls, and shear walls, is a mass timber product manufactured by fastening lumber to create a solid structural element from dimensional lumber (Binational Softwood Lumber Council, 2017). Although the structural, mechanical, and fire behaviors of NLT have been evaluated and reported in several studies (Derikvand et al., 2019; Herberg, 2018; Hong, 2017; Krämer and Blass, 2001), the moisture and dimensional behaviors are not primary concerns in NLT products. To the best of our knowledge, this study is the first to investigate moisture and dimensional changes in NLT. Investigating the moisture and dimensional behavior of slabs induced by ambient climate change will facilitate in understanding NLT–concrete slabs more comprehensively as well promote the development of reliable monitoring systems.
2. MATERIALS and METHODS
The slab used in this study comprises two layers: A lower wooden layer and an upper topping concrete layer. An NLT–plywood composite was used for the wooden layer. The raw material used for the lumber and plywood was Japanese larch wood (Larix kaempferi), measuring 24 mm × 140 mm × 1,000 mm (i.e., radial × tangential × longitudinal directions for lumber; thickness × height × length for plywood). All lumber was flat sawn wood or featured an end grain. The air-dry densities of the lumber and plywood were 0.55 and 0.66 g/cm3, respectively.
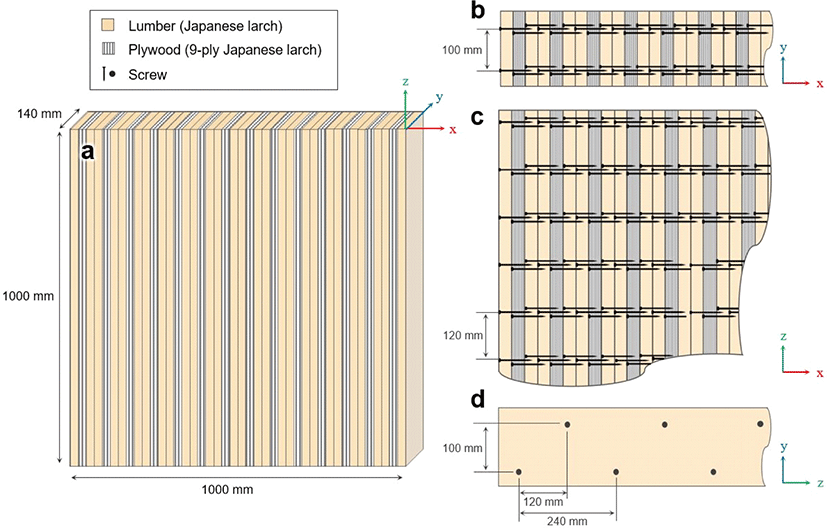
As shown in Fig. 1(a), a slab measuring 1,000 mm (width, x-direction) × 140 mm (height, y-direction) × 1,000 mm (length, z-direction) was assembled by repeatedly laminating the elements with screws in the lumber–plywood–lumber sequence. A total of 42 wooden elements, 28 lumbers, and 14 plywood were fastened using coarse thread drywall screws, and the length, head diameter, and shank diameter were 64, 8, and 4.2 mm, respectively. The screws fastened the wooden elements in two rows on the y–z surface of the elements [Fig. 1(d)]. The rows in each layer were arranged alternately.
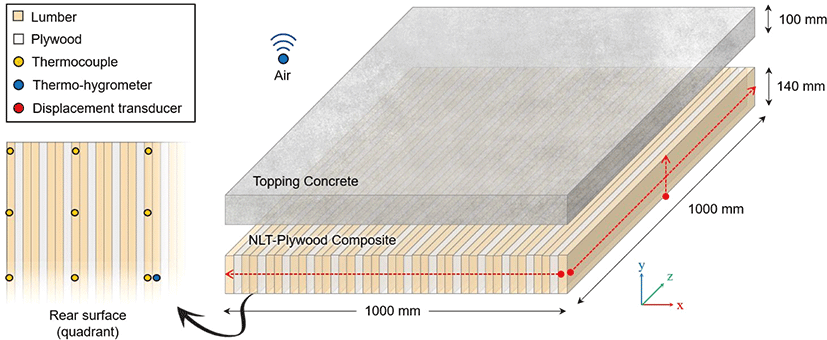
An NLT–concrete slab was constructed by placing topping concrete on the NLT–plywood composite (Fig. 2). The nominal strength, nominal maximum size of the coarse aggregate, and slump flow of the ready-mix concrete were 24 MPa, 25 mm, and 120 mm, respectively, and Type I Portland cement was used. The topping concrete was 100 mm thick and unbonded to the underlying NLT.
For long-term monitoring, the slab specimen was placed outdoors (37°45' 79.03’ ‘N, 126°94'79.62’ ‘E) at Seoul National University, Gwanak-gu, Seoul. The observation sites were a building on the east side, and a forest and valley on the west side. A canopy was installed over the slab to avoid direct sunlight and prevent rain wetting. The designed monitoring environment was harsher than the actual environment used for the slab. The slab temperature, RH, and dimensional changes were observed from April 14, 2021, to May 3, 2022 (385 d).
As illustrated in Fig. 2, type-K thermocouples (TCs) were installed at the bottom of the wooden slab to measure the internal temperature. Cavities with a diameter of 2 mm and depth of 70 mm were drilled at nine points in the bottom quadrant, and the TCs were inserted into the cavities. The gaps between the TCs and wooden slabs were sealed with polyvinyl acetate (PVA) adhesive to prevent temperature changes due to the inflow of outside air.
Two thermo-hygrometers (HMP 60, Vaisala, Vantaa, Finland) were installed to measure the temperature and RH of the wooden slab and the external air. The sensor used for the slab was inserted at a depth of 70 mm and was double sealed using PVA adhesive and silicone sealant in the center of the slab bottom; meanwhile, the sensor for air was placed in an instrument shelter.
The dimensional change in the slab was measured using three wire tension-type displacement transducers (DP-500G, Tokyo Measuring Instruments Laboratory, Tokyo, Japan) installed in the slab surface width (x), height (y), and length (z) directions. The details of the sensors used to monitor the slab are listed in Table 1.
The data generated from the sensors installed in the NLT–plywood composite were controlled using a data logger (CR3000, Campbell Scientific, Logan, UT, USA) equipped with a relay multiplexer (AM16/32B, Campbell Scientific). All sensors provided measurements for each target at 30 s intervals, and the dedicated data logger software provided real-time sensor data monitoring. Average values provided by the TCs, thermo-hygrometers, and displacement transducers for 30 min and 24 h were acquired from the data logger and used to analyze the temperature, RH, and dimensional changes of the slab.
The EMC was calculated using the temperature and RH data from the thermo-hygrometer sensors to evaluate the change in moisture inside the slab. The Hailwood–Horrobin equation (Hailwood and Horrobin, 1946) was employed to calculate the EMC, as follows:
W = 349 + 1.29T + 0.0135T2
k = 0.805 + 0.000736T – 0.00000273T2
k1 = 6.27 – 0.00938T – 0.000303T2
k2 = 1.91 + 0.0407T – 0.000293T2
where T is the temperature in Celsius; h is the RH (%); W, k, k1, and k2 are the fundamental constants of the Hailwood–Horrobin sorption model.
Moisture fluctuations in the NLT slab result in dimensional changes. The displacement values in the x-, y-, and z-directions were converted into strain values using the following equation to measure the dimensional change of the slab:
where ε is the strain, li the initial length, and ld the deformed length of the NLT slab.
EMC fluctuation-induced strains were calculated using the reference shrinkage of Japanese larch wood (Kim and Lee, 2002; Park et al., 2015) based on the measured shrinkage of plywood to investigate the effect of the nail-laminated structure on dimensional change. Because the slab was a laminated structure composed of lumber and plywood, the calculated strain in the x-direction (width) was weighted for each element, as follows:
where ε%S, ε%L, and ε%P are the strains per 1% MC of the slab, lumber, and plywood, respectively, below the fiber saturation point; NL and NP are the number of lumber and plywood elements constituting the slab, respectively; NT is the total number of elements. The calculated strains were compared with the strains measured using displacement transducers.
3. RESULTS and DISCUSSION
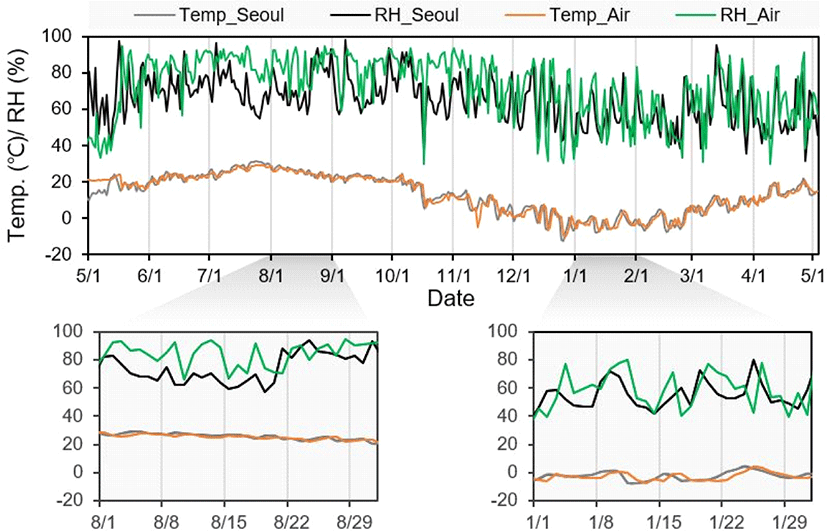
Fig. 3 shows a comparison of the temperature and RH at the observation site with those of Seoul during the same period. The daily temperature fluctuation at the observation site showed a trend similar to that of Seoul. The mean temperature in the area during the monitoring period was 13.4°C, which is equivalent to 13.5°C in Seoul. However, the RH of the observation site was higher than that of Seoul and indicated more significant fluctuations. As shown in the subplots in Fig. 3, the observation site experienced a more humid climate than the reference area of Seoul in the summer. The mean and standard deviation of the RH at the observation site during the monitoring period were 70.4% and 18.4, respectively, which were higher than the reference values of 64.8% and 13.2, respectively. Forests and valleys in the vicinity may have affected the wet environment of the observation site.
The internal temperature of the NLT slab, as acquired using the TCs, reflected the air temperature. The speed at which the air temperature affected the slab differed depending on the TC location. The TCs at the edge of the slab (TC1, TC2, TC3, TC4, and TC7 in Fig. 4) recorded temperatures similar to the air temperature, with a time difference of 60 min. Meanwhile, the TCs near the center (TC5, TC6, TC8, and TC9 in Fig. 4) recorded temperatures similar to the air temperature at intervals of 90–120 min. The TC position affected the range of temperature fluctuation. Based on the subplot shown in Fig. 4, the temperature recorded by the five TCs located at the edge of the slab showed more significant changes than that by the four TCs inside, resulting in the formation of two clusters.
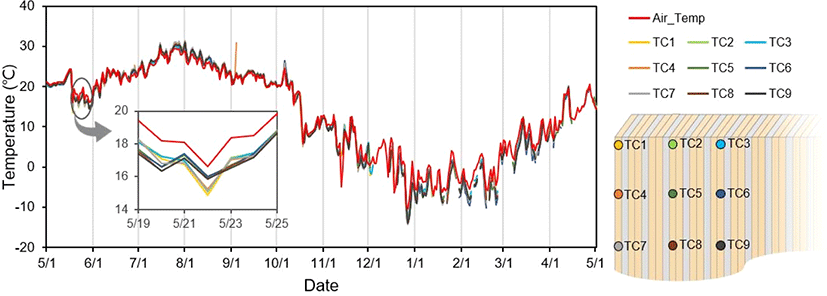
Table 2 lists the descriptive statistics of the data obtained from the external air and the slab. In contrast to the temperature change, the RH fluctuation of the air was not directly reflected in the internal RH of the NLT slab, and the fluctuation reduced significantly [Fig. 5(a)]. Naturally, the change in the air RH would change the internal RH of the slab. However, the internal RH fluctuations were much gentler, which was due to the damping and delayed adaptation of moisture (Dietsch et al., 2015b). The mild RH change in the NLT slab was attributed to the humidity control of the wood material.
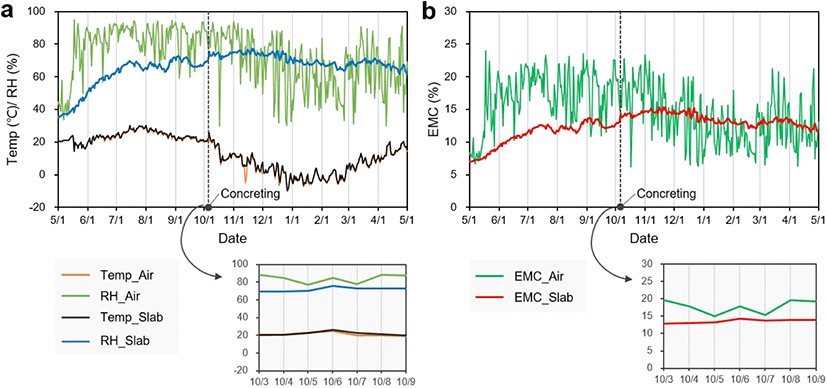
Fig. 5(b) shows the EMC of the air and NLT slabs calculated using the Hailwood–Horrobin equation. The changes in the EMC reflected the fluctuation pattern of the RH. This is because RH is a critical factor that determines the EMC. During the monitoring period, when the air EMC fluctuated in the range of 6.2%–24%, the EMC change in the slab was 6.7%–15.3% (Table 2). The high MC of wood, i.e., exceeding 20%, would deteriorate the strength and biodegradation of the slabs (Kirker et al., 2016; Shupe et al., 2008). However, such defects are unlikely to occur within the internal EMC range of the slab investigated in this study.
The effect of concrete pouring on moisture change in the NLT slab was negligible. The slight increase in the internal RH and EMC of the slab observed immediately after pouring concrete (October 5, 2021) was due to the increase in the air RH, not the moisture in the concrete mixture (Fig. 5). This is because the internal moisture of the slab did not increase continuously after concrete pouring and reflected the air RH fluctuations [subplots in Fig. 5(a) and (b)]. These results indicate that concrete pouring is not a significant factor in increasing the internal moisture of the slab.
Table 3 and Fig. 6 show the linear dimensional changes in the width, height, and length directions induced by the changes in the internal moisture of the NLT–plywood composite. The changes in the width and length were the most and least significant, respectively (Table 3). The patterns of dimensional change in the three directions were similar to those of the internal EMC fluctuation of the slab (Fig. 6).
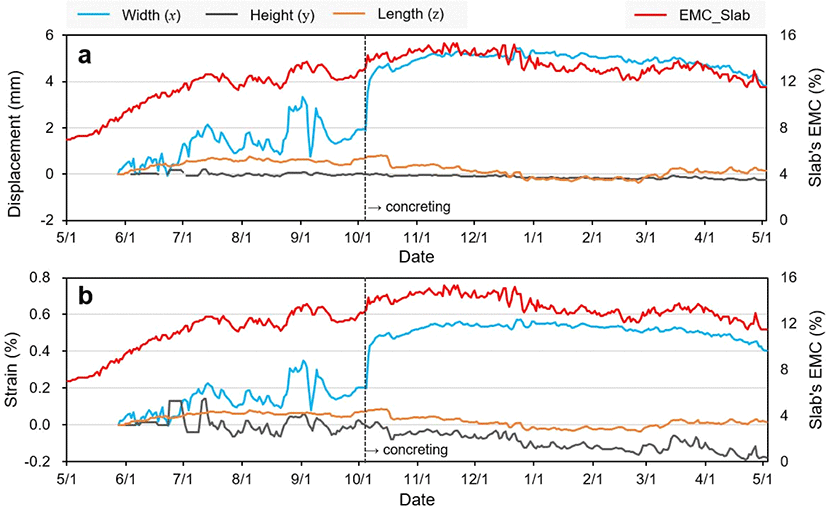
The internal EMC at the end of the observation was higher than that at the beginning; hence, volume swelling of the slab was expected. However, the width and length increased, whereas the height decreased. Because flat-sawn wood was used as the lumber element of the NLT–plywood composite, the height of the latter corresponded to the tangential direction. Considering the shrinkage and swelling anisotropy of wood, the dimensional change in the tangential direction should be greater than those in the radial and longitudinal directions. Therefore, a decrease in the height direction is difficult to interpret theoretically. The displacement transducer installed in the height direction caused the wire to bent 90° relative to its typical travel path by pulleys installed on a narrow surface. It appears that the artificial change in the wire travel path generated unexplained displacements in the height direction. Therefore, the height direction was not considered in the dimensional change analysis.
The internal EMC of the slab, which increased continuously since the monitoring began, reached a maximum value of 15.3% on November 22 and started declining as winter approached. Accordingly, the slab width changed as well (Fig. 6). However, the length strain was extremely small, i.e., approximately zero [Fig. 6(b)]. The acute swelling in the width caused by concrete pouring, as shown in Fig. 6(a) and (b), is noteworthy. After the concrete was poured, the width strain increased by 0.23%. This significant deformation was irreversible and permanent, as it did not recover during the subsequent internal EMC reduction phase. As mentioned earlier, concrete pouring did not increase the internal moisture of the slab. Therefore, the width deformation was likely due to external factors, such as the loosening of the nail lamination due to the load of the concrete mixture. The nail-laminated system implies low resistance in the lamination direction (Binational Softwood Lumber Council, 2017).
Table 4 shows the calculated radial strains of the lumber and the thickness strains of the plywood corresponding to the width strain of the NLT slab. Comparing the calculated and measured values of the width deformation, the strain per 1% change in the EMC measured by the displacement transducer was 0.83%, which is approximately 39% lower than the calculated strain of 0.136% (Table 4). The low measured strain was attributed to the suppression of dimensional changes by the nail-laminated structure, as well as the restraining effect caused by the load of the concrete topping.
| Component | EMC (%) | Strain (%) | Strain/%EMC | Reference | |
|---|---|---|---|---|---|
| Min. | Max. | ||||
| NLT slab (measured) | 8.9 | 15.3 | 0.53 | 0.083 | - |
| Before concreting | 8.9 | 13.7 | 0.33 | 0.068 | - |
| After concreting | 11.5 | 15.3 | 0.15 | 0.041 | - |
| NLT slab (calculated) | - | - | - | 0.136 | - |
| Lumber | 0 | 16.0 | 2.09 | 0.1421) | Kim and Lee (2002) |
| 0 | 10.8 | 1.64 | Park et al. (2015) | ||
| Plywood | 6.3 | 13.3 | 0.88 | 0.1262) | Measured |
Fig. 7 shows plots of the measured and calculated strains in the width direction. Although the measured values were lower than the calculated values, the variation patterns of both were similar. Near the monitoring end, the measured and calculated strains were reversed, which implies that the significant increase in the width due to concrete pouring was permanent. The variation in the measured strain after concrete pouring reduced significantly. The strain per 1% of EMC decreased from 0.068% to 0.041% after concrete placement (Table 4). These results suggest that the nail lamination structure loosened because of concrete pouring. This is because the space created by the loose nail-laminated structure offset the actual dimensional change of the composite elements.
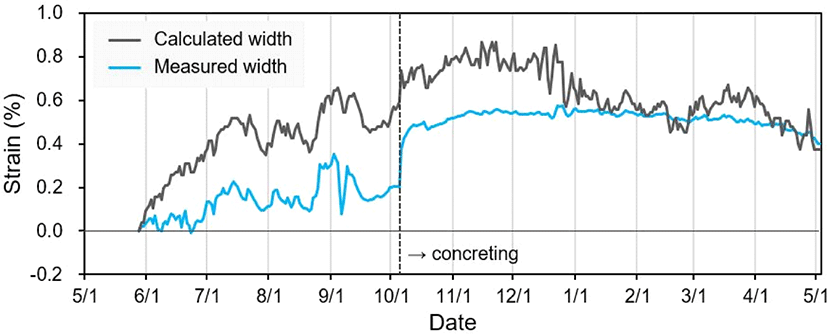
Dimensional changes are critical to structural stability. In this study, the NLT–concrete slab was lifted from the ground throughout the monitoring period to ensure smooth shrinkage and swelling. This experimental design may have loosened the nail-laminated structure. At timber construction sites, such permanent changes in dimensions are expected to be reduced using beams to support the lower section of the slab.
The monitoring of the improved slab using more precise sensors that can compensate for the technical limitations of this study is in progress. Subsequent studies will be performed to investigate the effects of the base NLT and topping concrete slabs on moisture and dimensional changes.
4. CONCLUSIONS
The change in air temperature was almost directly reflected in the internal temperature of the NLT–plywood composite. By contrast, the change in RH was moderate because the humidity of wood was controlled. During the monitoring period of 385 d, the internal EMC of the composite fluctuated within the range of 6.7%–15.3%, and the change in moisture resulted in dimensional change. Concrete pouring did not substantially affect the internal moisture of the composite, and the nail-laminated structure suppressed dimensional change. The dimensional stability of the designed NLT–plywood composite was demonstrated by its dimensional change, which was less than that of each of its constituent element.


