1. INTRODUCTION
The area occupied by oil palm plantations in Indonesia is increasing every year. Based on the Indonesian Plantation Statistics on Palm Oil Commodities (Directorate General of Estate Crops, 2018), the area increased by 67.5% from 2010 to 2017, from 8,385,394 ha in 2010 to 14,048,722 ha in 2017. As the total oil palm plantation area has become larger, the production of palm oil stem waste has consistently become greater as well. The productive period of the oil palm is 5–25 years, and after more than 25 years, it will be felled and replaced with a new oil palm. During this process, the amount of waste products can reach 220 m3/ha, while as much as 50–75 m3/ha of sawn timber can be obtained from the trunks of felled trees (Balfas, 2006; Febrianto and Bakar, 2004; Hambali and Rivai, 2017). The total amount of oil palm waste production indicating the total volume of harmful carbon dioxide emission based on its life cycle inventory (Chang et al., 2016). Due to these reasons, the oil palm waste very potential to be utilized as bio-composite products raw materials.
In oil palm plantations, unproductive stands produce waste in the form of oil palm trunk (OPT). Trunks are typically destroyed by being burned or left to rot, which can attract insect pests that may attack healthy trees in oil palm plantations. A considerable amount of research has focused on finding uses for OPT and enhancing its economic value. OPT tends to be more cylindrical than the trunks of other wood species. It can be predicted that OPT will had yield (Jeong et al., 2016). One option for using OPT is in the manufacture of products such as laminated boards. However, composite products that have been selected for studying the use of OPT contain many weaknesses in terms of dimensional stability, strength, and durability (Way et al., 2010; Hartono, 2012).
The wood used for structural purposes must have strength and durability. In particular, the wood for buildings should have strength class I–III and durability class II–III (Martawijaya et al., 2005). Pramunendar and Supriyanto (2014) reported three classes of density for sawn timber: high density (≥0.70 g/cm3), medium density (≥0.50–0.70 g/cm3), and low density (<0.50 g/cm3). Strength classes according to Martawijaya et al. (2005) can be seen in Table 1.
| Strength class | Modulus of rupture (MPa) |
|---|---|
| I | >108 |
| II | 71-108 |
| III | 49-71 |
| IV | 35-49 |
| V | <35 |
Source: Martawijaya et al. (2005)
A large amount of research has been conducted on laminated board made from OPT. Several studies used the outer third of OPT (Darwis et al., 2014b), while others used low-density OPT for the core of the laminated board, plywood for the face, and high-density OPT for the back (Tarigan et al., 2015). In other studies, the innermost layer made from low-density OPT was compressed with a specific pressure of 3.43 MPa (Hartono et al., 2011; 2012) to avoid defects during processing (Song and Hong, 2016), but the products could not be used for structural purposes. Altogether, these studies indicate that raw materials with high density and modulus of elasticity (MOE) must be used for the outer layers for best performance of laminated boards (Byeon et al., 2017; 2018).
Based on these findings, the author aimed to improve the physical and mechanical properties of laminated board constructed from OPT by utilizing the outer third of OPT in cross-section for the face layers and the less-dense underlying third for the core layer. Densification of low- to medium-density lamina was done by hot press at 150 °C for 60 minutes with pressure at 2.94 MPa or 4.41 MPa. Various combinations of laminas were used to create OPT laminated board. Improvement of the physical and mechanical properties of OPT laminated boards was then tested.
2. MATERIALS and METHODS
The OPT used as raw material in this study was taken from an unproductive stand that was more than 25 years old, and the laminas were produced from the outermost two-thirds of the OPT. The outer third of the trunk in cross-section had high-density wood, while the underlying third had low- to medium-density wood. The laminas were sorted based on their MOE value using nondestructive testing, according to Lestari et al. (2018). In brief, the laminas were placed on two pedestals, and then a load was applied to each lamina for measurement of the magnitude of deflection using a deflectometer. A smaller MOE value indicated a larger deflection value and vice versa. The laminas were graded and sorted into two grades, high MOE (group E1) and low MOE (group E2).
Through densification, laminas that were originally 5 cm × 1.5 cm × 65 cm (in width, thickness, and length, respectively) became 5 cm × 1 cm × 65 cm. Prior to densification, the density of lamina ranged from 0.20 to <0.70 g/cm3. The laminas were hot compressed at 150 °C for 60 minutes with specific pressures at 2.94 MPa or 4.41 MPa.
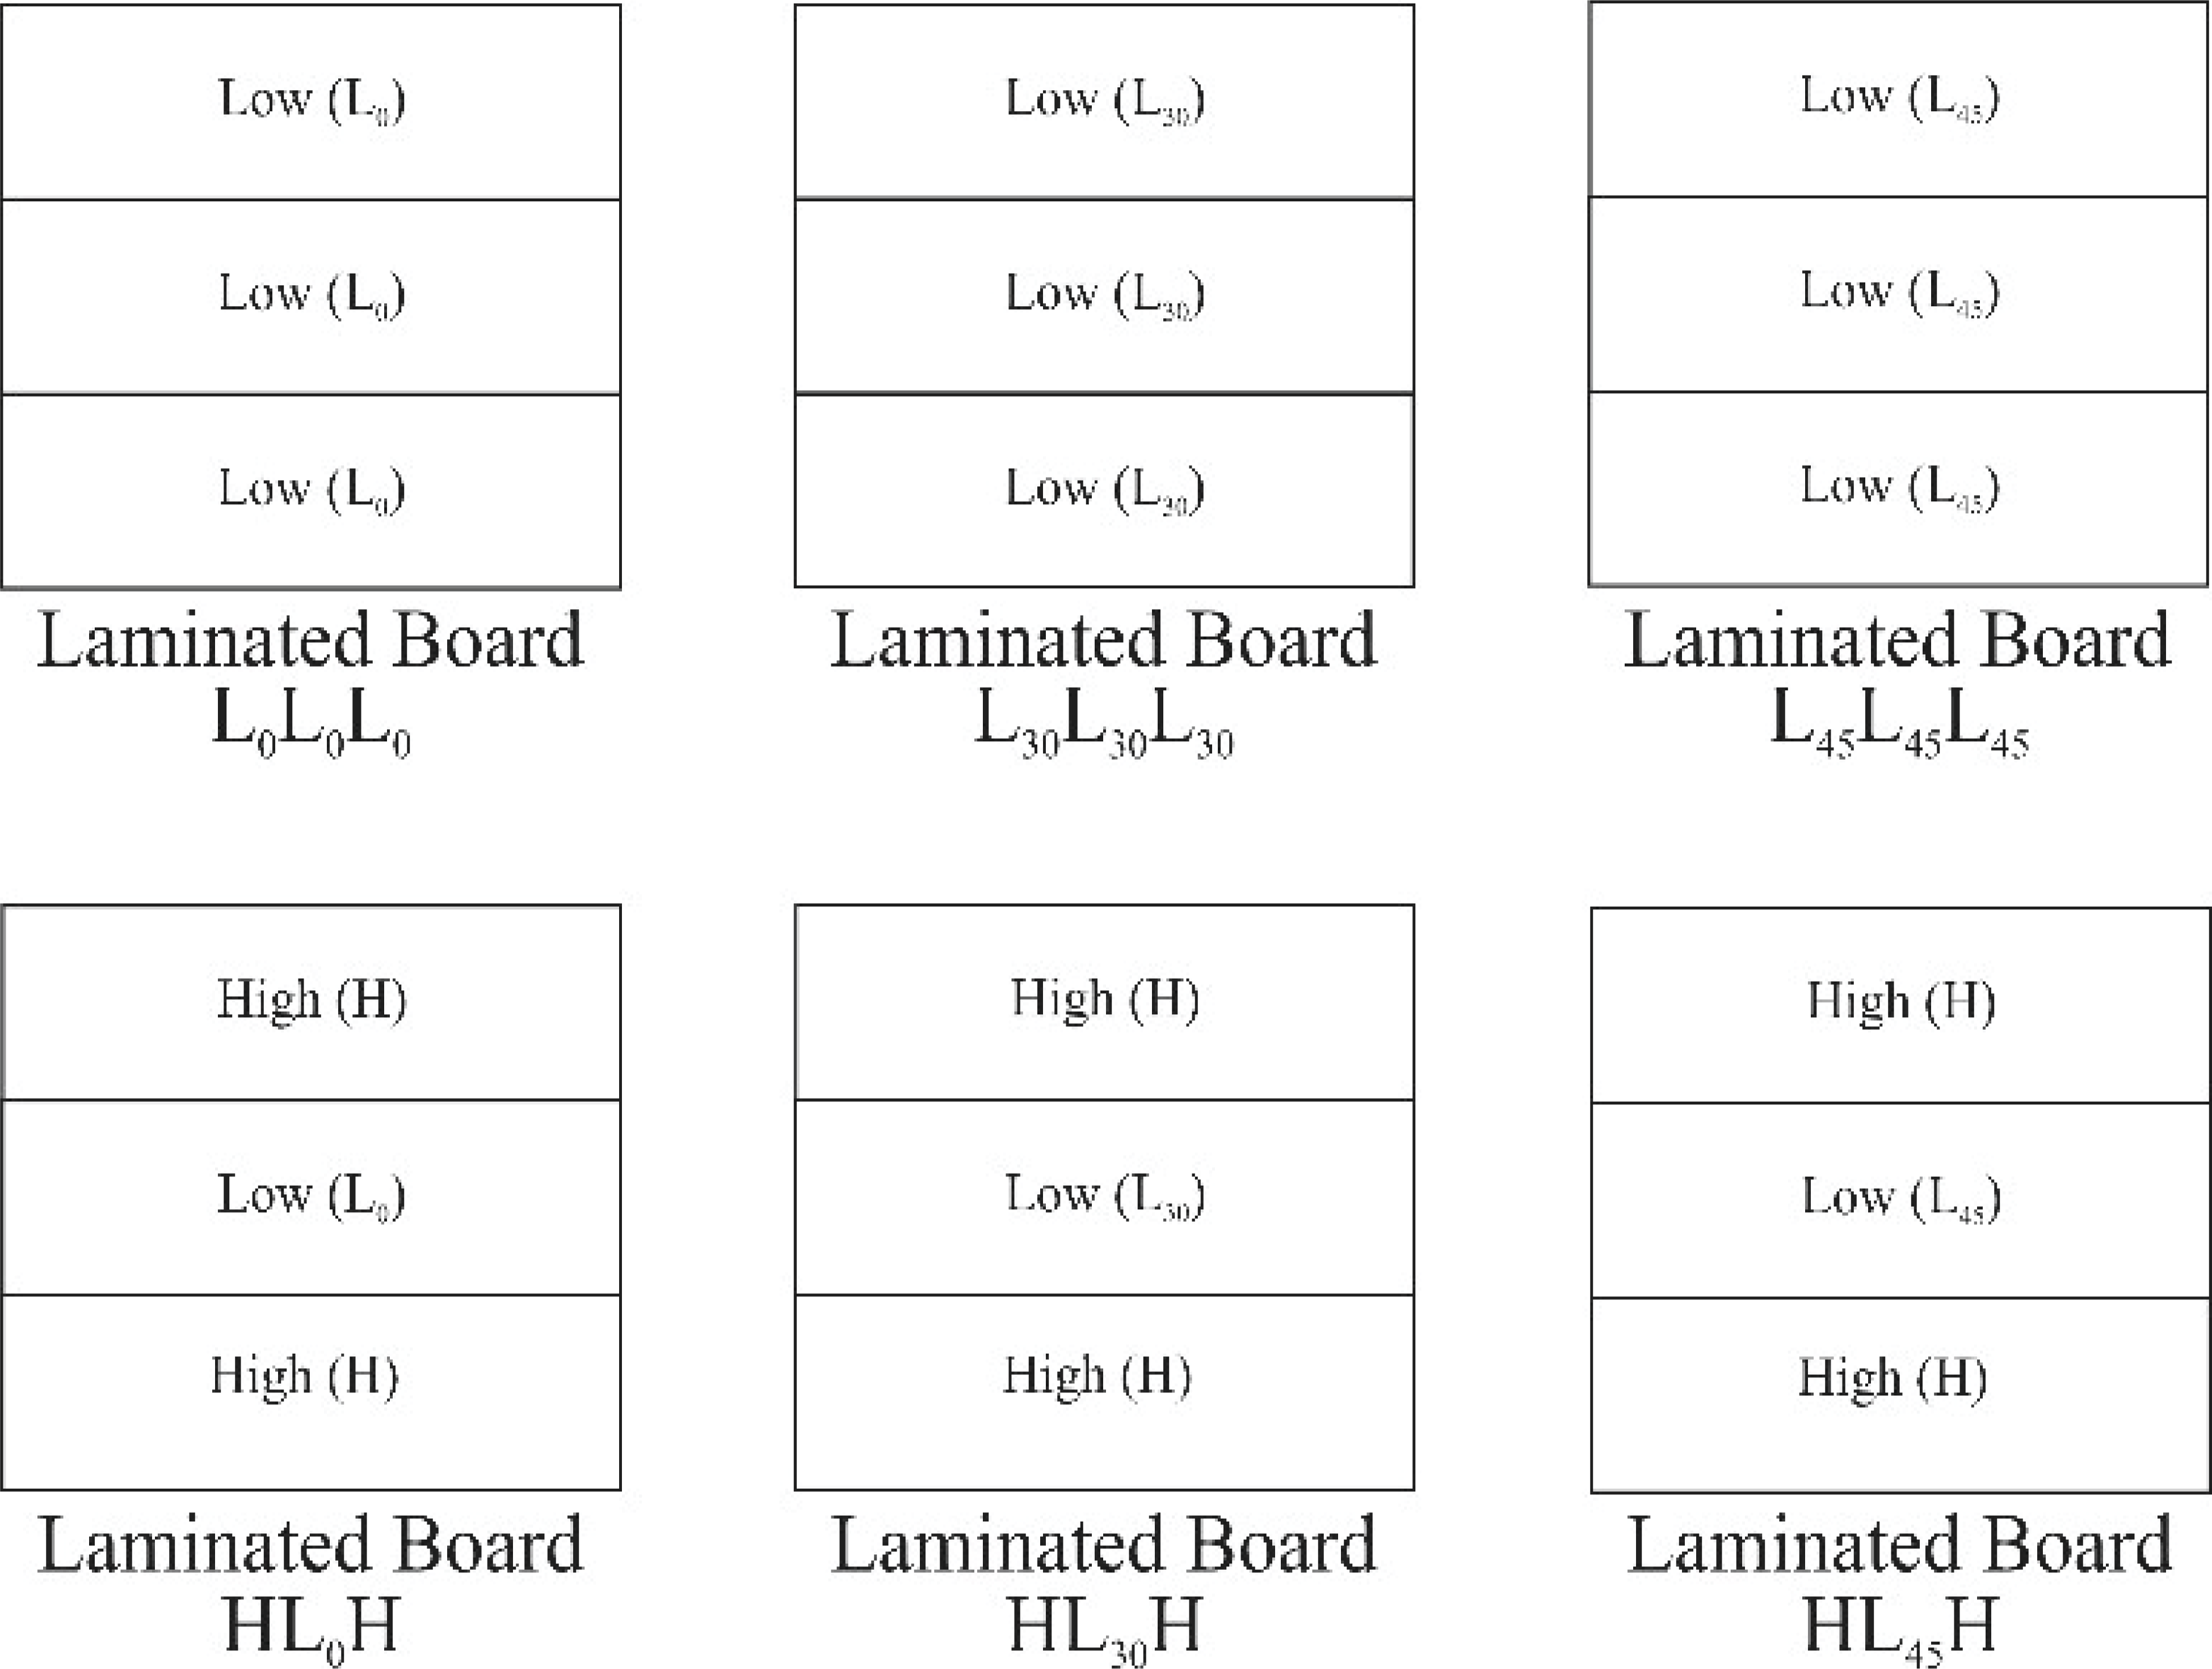
Laminated boards measuring 5 cm × 3 cm × 65 cm (width, thickness, and length, respectively) were composed of three layers of lamina measuring 5 cm × 1 cm × 65 cm. Each treatment consisted of five replications. The laminas were categorized as high density (H) (≥0.60 g/cm3) or low to medium density (L) (0.20–0.60) g/cm3. The low- to medium-density laminas were pretreated with hot press with pressure at 2.94 MPa or 4.41 MPa to produce L30 and L45 laminas, respectively. Untreated low-density lamina (L0) was also prepared for comparison purposes. Three layers of laminas (face-core-back layers) were combined in the following arrangements: L0L0L0, L30L30L30, L45L45L45, HL0H, HL30H, and HL45H, as shown in Fig. 1.

The adhesive used to bond the laminas was isocyanate with a ratio of base to hardener of 100:15 based on weight, with a glue spread of 300 g/m2 (Darwis et al., 2014a). This adhesive is produced by Polyoshika Company Ltd Japan and distributed by PT Polychemie Asia Pasific Indonesia.
The laminated boards were produced using a cold pressing system (Hong et al., 2017). After the adhesives were spread on their surfaces, the laminas were pressed together while the resin cured. Compression was carried out with a cold press machine using a specific pressure of 0.98 MPa for 3 hours (Darwis et al., 2014a). Afterward, the laminated boards were conditioned for 1 week at room temperature. The manufacture of laminated board manufacturing is depicted in Fig. 2.
Testing of the physical and mechanical properties of the laminated board was carried out based on Japanese Agricultural Standard (JAS) 234-2003 (JAS, 2003) regarding glued laminated timber. The physical properties tested were density and moisture content (MC). The mechanical properties tested were MOE, modulus of rupture (MOR), and shear strength. MOE and MOR tests use one-point loading with a span length of 42 cm and a loading speed of 3 mm/min. The MOE, MOR, and shear strength were calculated as follows:
where ΔP is the difference between the upper and lower loading limits in the proportional limit region (kgf); ΔY is the deflection with respect to ΔP (cm); L is span (cm), b and h are width and thickness of the laminated board, respectively (cm); and P is the maximum loading (kgf). This study used a factorial (2 × 3) in completely randomized design. The first factor was the arrangement of laminas (i.e., the combination of L and H laminas), and the second factor was the densified lamina (i.e., L0, L30, L45). Duncan’s multi range test was used for further analysis if a factor was significantly different at P ≤ 0.05.
3. RESULTS and DISCUSSION
The MC of laminated boards ranged from 12% to 13% (Fig. 3). The MC of all laminated boards met the JAS 234-2003 standard, which requires a maximum value of 15%. Kretschmann and Green (1996) stated that MC and density are basic quality indicators that influence the strength of wood: the lower the MC, the higher the wood strength. The average MC of all the laminated boards was 12.0% because the constituent laminas had MC values ranging from 10% to 12%. Komariah et al. (2015) stated that the MC of laminated board is influenced by the MC of each constituent lamina.
Based on the analysis of variance shown in Table 2, the MC of laminated board was influenced by how the laminas were arranged, the use of densified laminas, and the interaction of the two factors. Duncan’s advanced test results (Table 3) showed that the laminated board composed of laminas arranged as L30L30L30 and L45L45L45 had the lowest MC values, 11.08 % and 10.61%, compared with the boards composed of L0L0L0 (13.73%), HL0H (12.12%), HL30H (12.33%), and HL45H (12.63%). The arrangements L30L30L30 and L45L45L45 were not significantly different from each other, and both were significantly different from L0L0L0, HL0 H, HL30H, and HL45H boards. The difference was likely due to the laminas having been treated by hot pressing, which would have forced out the water inside the cell and thereby changed the cell structure of the wood. Due to the cells shrinking, the MC would have decreased (Amin and Dwianto, 2006).
| Combination of lamina arrangements | Pressure (MPa) | ||
|---|---|---|---|
| 0 | 2.94 | 4.41 | |
| LLL | 13.73c | 11.08a | 10.61a |
| HLH | 12.12b | 12.33b | 12.63b |
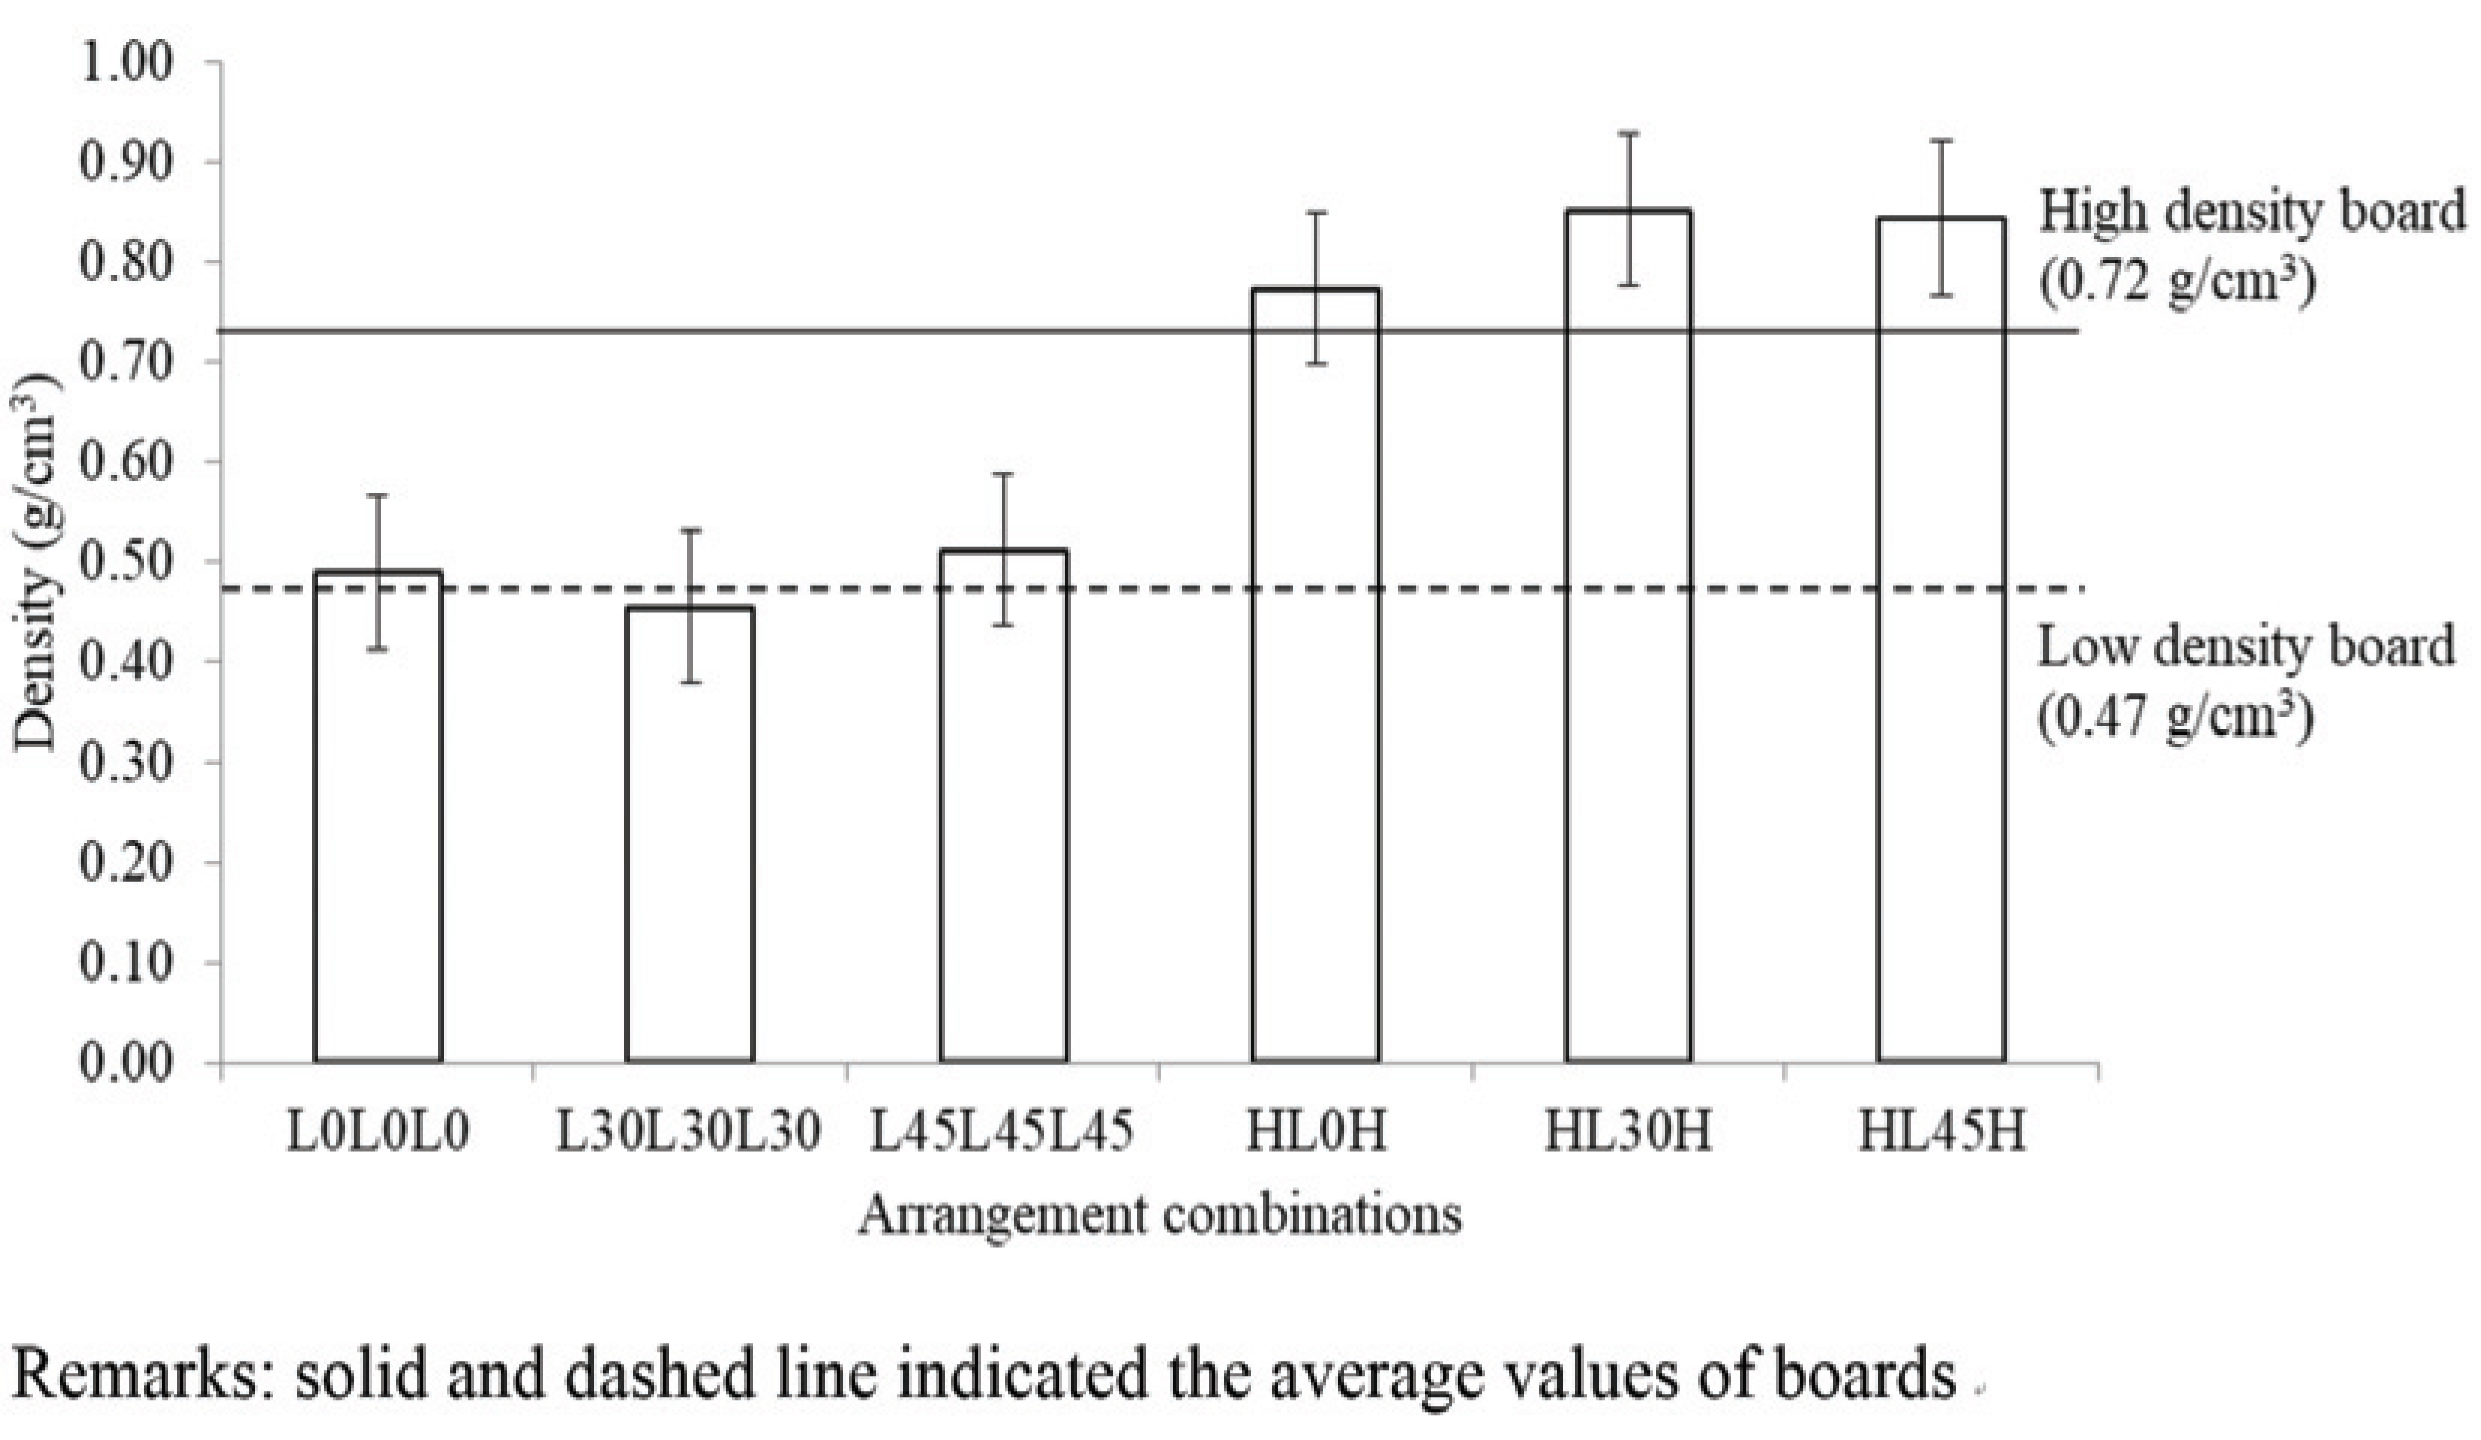
The density of the laminated boards produced ranged from 0.45 g/cm3 to 0.84 g/cm3, with the highest density being obtained with the laminas combined as HL30H (0.85g/cm3). The values for laminated board densities can be seen in Fig. 4.

The characteristics of the laminated boards produced were influenced by the lamina constituents; the higher the density of the lamina, the better the density of the laminated boards produced (Bodig and Jayne, 1982). Lamina from the outer third of the OPT had a high density because the number of vascular bundles distributed in the trunk tissue is more than in the underlying wood of the OPT. Bakar and H’ng (2008) reported that the vascular bundles are spread unevenly in the OPT, with the amounts being denser in the outside layers and decreasing toward the central part of the trunk.
The results of the analysis of variance in Table 2 show that the arrangement of the laminas influenced the density value of the laminated board, while the densified lamina and the interaction between the lamina arrangement and the densified lamina did not affect the density of the laminated board. Based on the results in Table 2, it can be seen that the density of boards composed of L0L0L0 laminas was lower than that of HL0H boards, which was likely due to the difference in the distribution of the vascular bundles in the OPT. Hartono (2012) indicated that a higher vascular bundle content would increase the content of the fibers that make up the OPT, which would strength the palm oil stem and increase the density value.
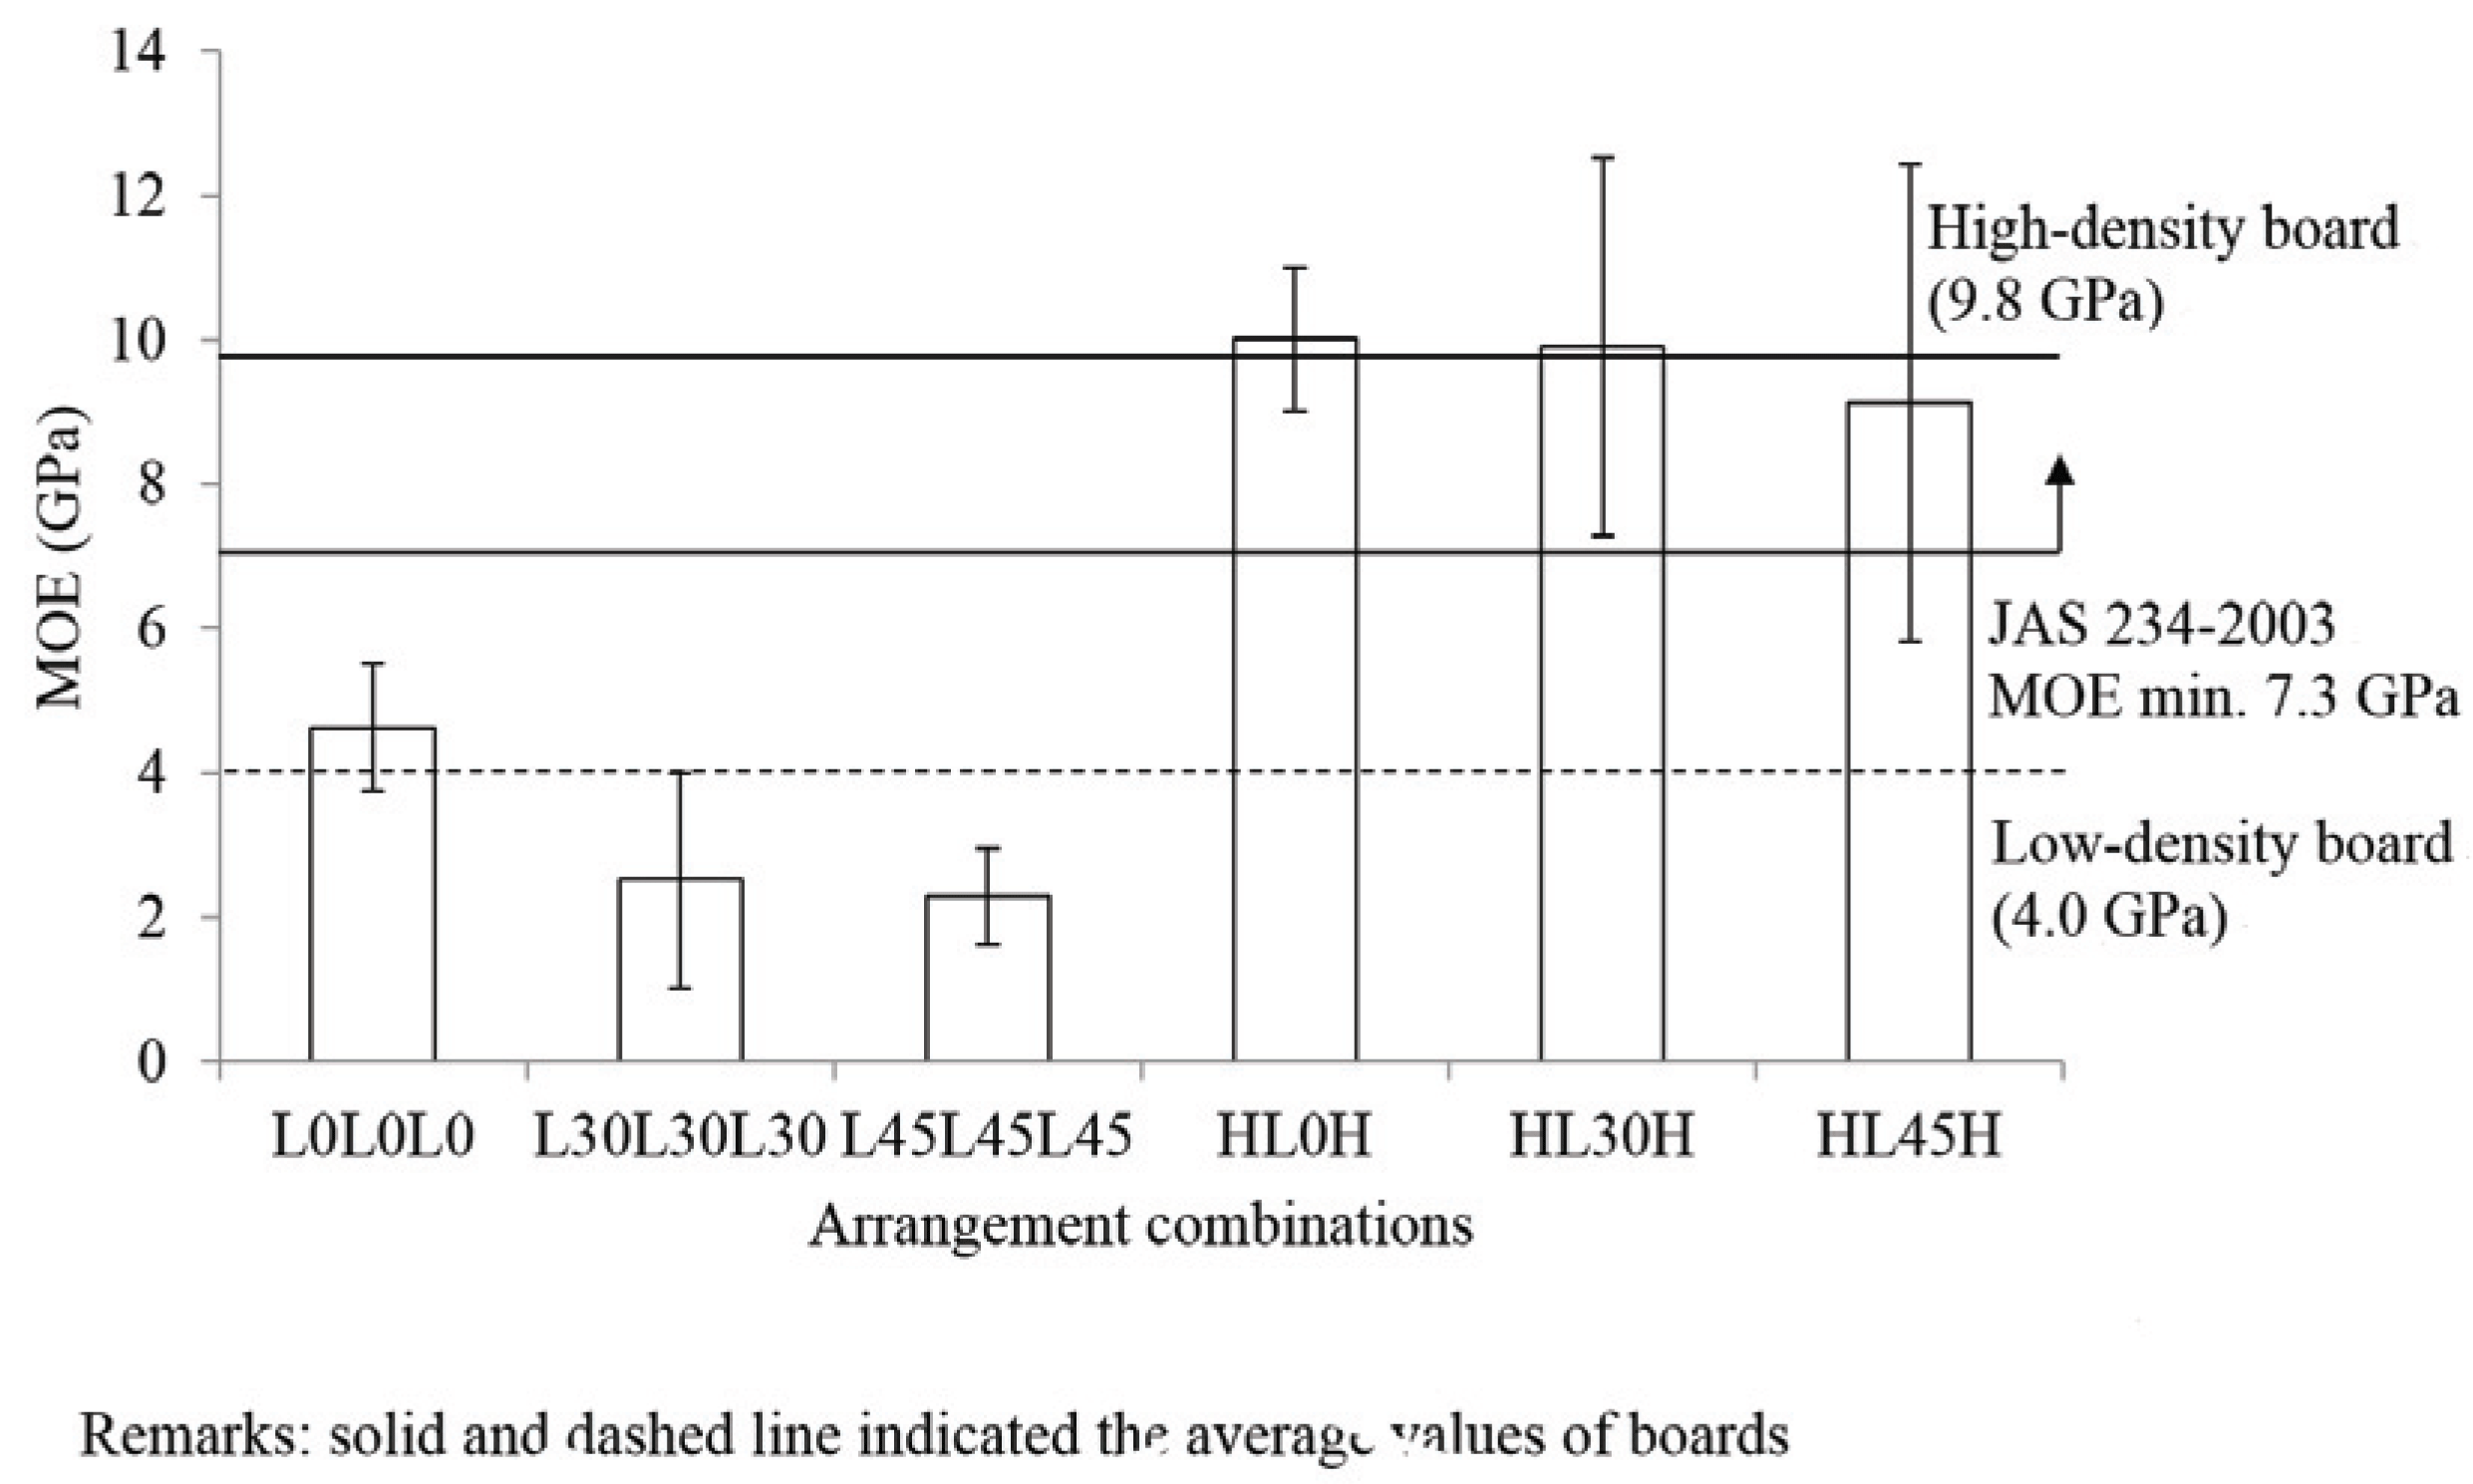
The MOE values ranged from 2.28 GPa to 10.01 GPa, with the highest MOE value being found for the HL0H boards (10.01 GPa). The overall MOE values of the laminated boards can be seen in Fig. 5.

Not all the laminated board MOE values met the JAS 234-2003 standard, which requires a minimum value of 7.3 GPa. Combinations that met the standards were HL0H (10.01 GPa), HL30H (9.90 GPa), and HL45H (9.13 GPa). Laminated boards made with high-density laminas for the outer layers had higher MOE values compared with those with low-density laminas for the outer layers. The average value for the former was 9.87 GPa, which is higher than the MOE of sengon and jabon laminated boards made with phenol-resorcinol formaldehyde and similar to those made with mangium wood (Hendrik et al., 2019).
This is because high-density lamina has thicker cell walls compared with low-density lamina, consequently the high-density lamina potentially has a higher capacity to handle the compression and tension forces.
The MOE values found in this study were higher value than those report by Darwis et al. (2014a), who found that the MOE values of OPT produced from outermost third of the trunk did not met the required standards.
Based on the analysis of variance (Table 2), only the arrangement of the laminas significantly affected the MOE values of the laminated board. Densification of the core lamina did not significantly affect the MOE value because the compression and tensile forces on the core lamina of laminated board are much smaller than those on the outer laminas. This interpretation is in accordance with the concept of the bending stress diagram shown in Fig. 6. When the load was applied, the top of the laminated board received the maximum compression force, while the bottom part received the maximum tension force. The center layer (i.e., the neutral line) did not experience these compression and tension forces; however, it received maximum shear force. These results indicate that low-quality lamina can be used for the core part of laminated boards.
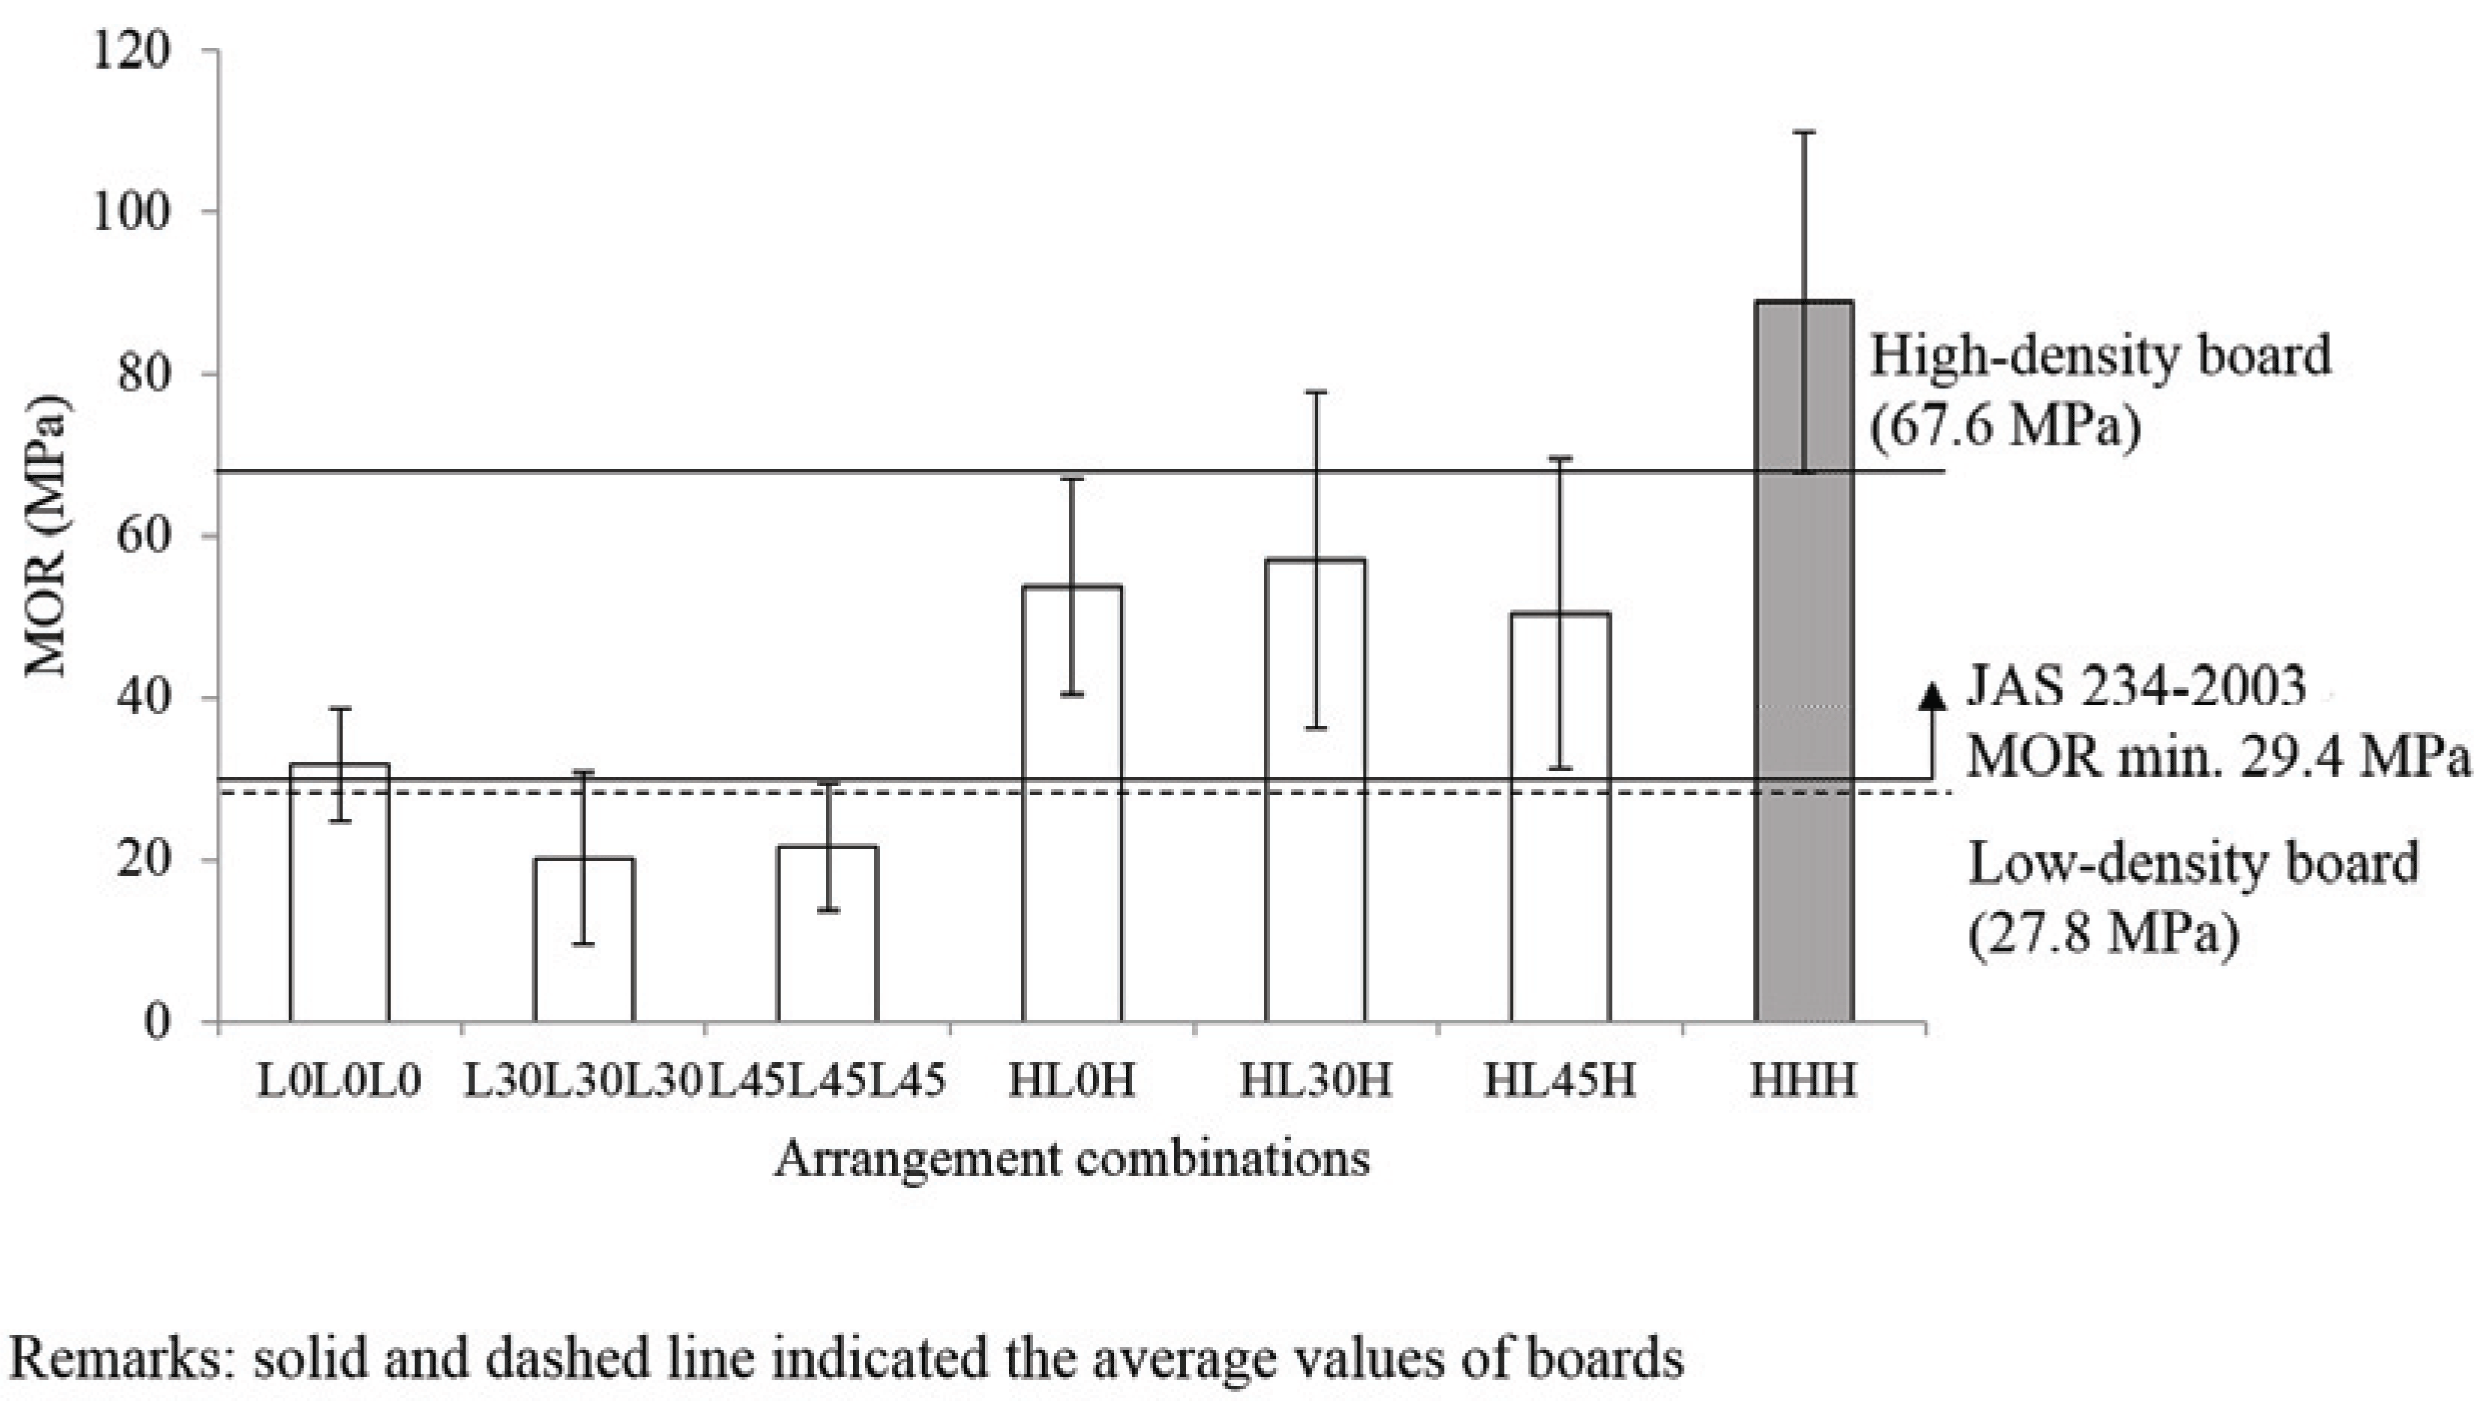
The MOR value of the laminated board produced ranged from 20.2 MPa to 56.98 MPa, with the highest MOR value being found for HL30H (56.98MPa). The overall MOR of the laminated boards can be seen in Fig. 7.

The MOR values of the laminated boards produced did not all meet the JAS 234-2003 standard, which requires a minimum laminated board MOR value of 29.4 MPa. Combinations that meet the standards were L0L0L0 (31.58 MPa), HL0H (53.64 MPa), HL30H (56.98MPa), and HL45H (50.41MPa). Based on the analysis of variance (Table 2), the arrangement of the laminas was the only factor that affected the MOR value. Lestari et al. (2015) and Darwis et al. (2013) stated that the MOR value of laminated board is influenced by the density of the constituent laminas: the higher the density of the constituent laminas, the higher the MOR of the laminated board. The MOR value for the lamina with the highest density in the outer layer was 54.7 MPa. Based on the study by Hendrik et al. (2019), this value is higher than those found for jabon and sengon wood.
The MOR value determines the strength class of the laminated board produced. The results showed that HL0H, HL30H, and HL45H laminated boards belonged to strength class III, while HHH laminated boards belonged to strength class II. According to Martawijaya et al. (2005), the raw materials for structural construction have a minimum requirement of being strength class III.
Thus, even though the laminated board core part received only small tensile or compressive stress, it could reduce the strength class of the laminated board produced; however, the decrease in the strength class was not significant. The combinations L0L0L0, L30L30L30, and L45L45L45 belonged to strength class V, which is not suitable for structural construction (Martawijaya et al., 2005). Strength class values can be seen in Table 1.
The shear strength values of the laminated boards can be seen in Fig. 8. None of the laminated boards produced met the JAS 234-2003 standard, which requires a minimum laminated board shear strength of 5.3 MPa. The results of the diversity analysis test (Table 2) showed that the arrangement of the lamina, densified lamina in the core layer, and the interaction of these two factors did not significantly affect the shear strength value of the laminated board. However, the laminated board with HL0H (1.55 MPa to 2.02 MPa) had a higher shear strength value than L0L0L0 (1.35 MPa to 1.40MPa). The The value of the shear strength of laminated boards with high-density laminas in the outer layers was 1.85 MPa. This value was higher than that of jabon wood with phenol-resorcinol formaldehyde adhesive (Hendrik et al., 2019). Santoso et al. (2016) stated that laminated boards composed of high-density wood would have a high shear strength value as well.
4. CONCLUSION
Based on the research reported here, it can be concluded that the densification of the core lamina did not significantly affect the physical and mechanical properties of laminated boards. Using high-density laminas for the outer layers of laminated board fulfilled JAS 234-2003 for MOE and MOR and could be classified as strength class III in Indonesia class strength, which is suitable for structural construction raw materials. However, laminated board made with low-density lamina in the outer layers was classified as strength class V, which is not suitable for raw materials intended for structural construction.


