


1. INTRODUCTION
In some countries, including Indonesia, the production capacity of veneer and veneer based industries each year shows a fluctuating trend. For example, plywood production tended to decline from year to year since 1997. In 2002, the production of Indonesian plywood reached only 1.20 million m3 and continuously declined from the previous years. Furthermore, within a period of 2013-2017, the production of plywood the increase approximately reached 3.2-3.6 million m3 (PDI, 2016). Factors causing this fluctuation include lack of raw materials, government’s policies, and company’s internal factors. In the future, plywood industry may gradually increase as there are still great potentials to develop (CDMI, 2015).
Problem due to the lack of raw materials may be anticipated with two approaches. First, extending the raw material sources by using the raw materials with smaller wood diameters (Cahyono et al., 2015; Darmawan et al., 2015; Muñoz and Moya, 2018), fast growing and less recognized wood including the planting wood waste, such as thinning and pruning (Rowell, 1998). However, these types of wood have inferior characteristics that the following approach is greatly required, that is the utilization of lignocellulose containing materials to enrich the composite wood products (composite/ compound wood) (Santoso et al., 2000). The forms of compound wood products include fiberboard, particle board, waferboard, flakeboard, oriented strand board (OSB) and com-ply (Maloney, 1977; Rowell et al., 1986; Iswanto et al., 2017; Jang et al., 2017).
Actually, engineering efforts in improvement the quality of composite board kept conducted, one of which was to add veneer layer (com-ply). This addition of veneer layer could improve OSB surface appearance (Nuryawan and Massijaya, 2005; Bowyer et al., 2007). Besides, Biblis et al. (1996) stated that the addition of veneer of OSB surface increases the value of MOE and MOR up to 117%. The increases of MOE and MOR value were respectively 129.5% and 75.9%, found on MDF after veneer coating with better flexural properties (Cahyono et al., 2018). Veneer coating had also been proven increasing the com-ply resistance against the subterranean and drywood termites (Iswanto et al., 2017; Cahyono et al., 2018). Those strengths might become the choice for the industrial actors of forest products industries to well maintain their products’ continuity and variations. Moreover, the utilization of veneer made from less familiar wood in market, such as avocado wood and good-appearance wood as face veneer, includes pine and mahogany.
Besides color and appearance reasons, avocado, pine, and mahogany woods have good dimensional stability. The next challenge was whether the three types of wood veneer are able to improve the dimensional stability of composite board and other fundamental properties. Therefore, avocado, pine, and mahogany based veneers in this research were used for Oriented Strand Board surface coating. This research aimed at evaluating the Com-ply’s fundamental properties. The research result could provide one alternative composite product utilizing wood from the community forest, supporting the resources’ efficiency, yet still meeting the standard quality.
2. MATERIALS and METHODS
The material used in this study was the Oriented Strand Board (OSB) easily obtained from the local markets. The OSB was 1.0 cm thick, using strand from various types of wood and phenol formaldehyde as adhesive. The used veneer was made from pine, avocado and mahogany, respectively. The veneer was 1.5 mm thick and two adhesive types used in this research were isocyanate and epoxy. Isocyanate adhesive consists of base and hardener with the composition of 100:15, while the epoxy adhesive uses the composition of 100:100.
Veneer and OSB were cut in the size of 35 cm x 35 cm. The moisture contents of veneer and OSB before gluing process were respectively 7±0.32% and 12± 0.46%. The adhesive was applied with the single glue spread of 250 g m-2. The activity was then followed with layer arrangement and compression. OSB was used as core while the veneer was used as face and back layer materials. The arrangement was completely presented further in Table 1. Cold compression was given for 3 hours with the pressure of 15 kg cm-2. Before testing, the test samples were conditioned for two weeks. The conditioning was performed at room temperature (25°C) and relative humidity (RH) of 85% until the air-dry moisture content.
| Num. | Type | Adhesive | Core and Back Veneer |
|---|---|---|---|
| 1 | K | - | - |
| 2 | AI | Isocyanate | Avocado |
| 3 | AE | Epoxy | Avocado |
| 4 | PI | Isocyanate | Pine |
| 5 | PE | Epoxy | Pine |
| 6 | MI | Isocyanate | Mahogany |
| 7 | ME | Epoxy | Mahogany |
In the implementation of this study, testing was conducted on some physical and mechanical properties. The physical characteristics were analyzed include density, moisture content, water absorption, thickness swelling and linear expansion. The mechanical characteristics were examined using the universal testing machine (UTM). The samples' width and length for the bending test was 5 cm × 30 cm, while that for internal bonding (IB) and screw hold power (SHP) was 5 cm × 5 cm and 5 cm × 10 cm, respectively. All measurements referred to JIS A 5908-2003 standards (JSA, 2003).
This research used the completely randomized design with 7 treatments utilizing com-ply type K, AI, AE, MI, ME, PI, and PE. The common model of this design was as presented by Gaspersz (1991). If the treatment type was significant, Duncan advance test was further conducted to obtain the best combination.
3. RESULTS and DISCUSSION
OSB’s density was 0.70 g cm-3 with the standard deviation of 0.03. After the addition of veneer layers, the density increased approximately 22-28%. The density of all com-ply types were presented in Fig. 1. The increasing density was due to the addition of veneer and two adhesive layers in both face and back part. As the comparative material, the density of Samama plywood increases by 11-23% (Cahyono et al., 2017) while the density of Samama’s laminated veneer lumber (LVL) had also increased when compared before the adhesion process (Cahyono et al., 2018). The specific gravity of Samama is 0.39-0.59 and after made into LVL product, its specific gravity ranged from 0.45-0.51 (Cahyono et al., 2016; Cahyono et al., 2018). In addition, Cristescu (2006) explained that the increasing density was due to the veneer’s physical and anatomical changes at the adhesion areas. This statement was strengthened with the result of ANOVA explaining that com-ply type influences its density (Table 3).
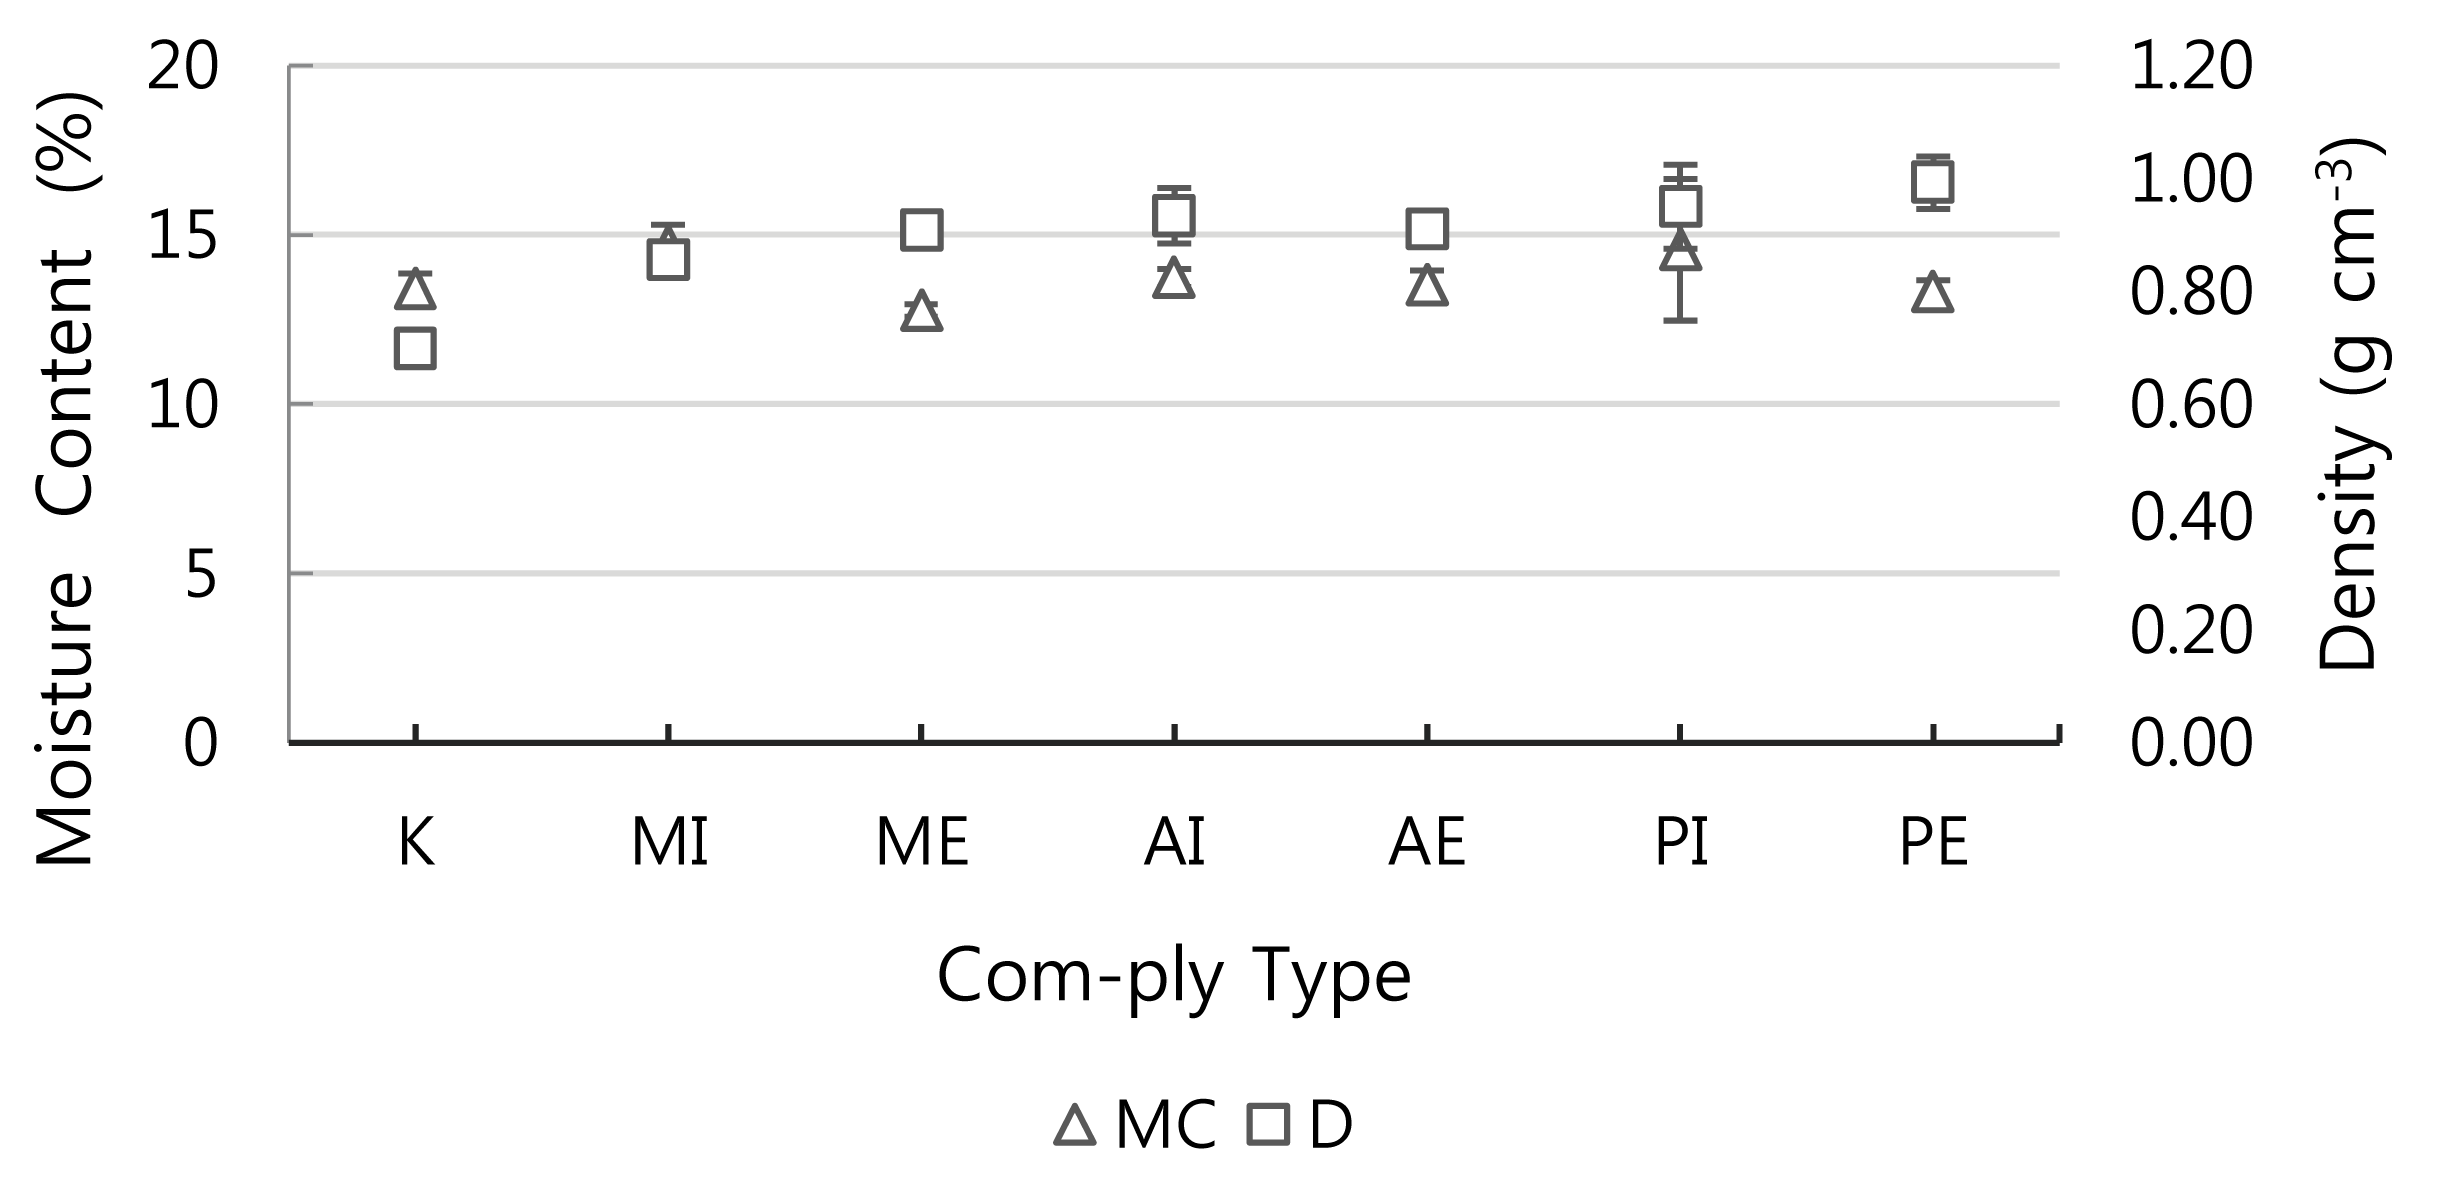
The further Duncan Test showed that the com-ply which outside layers was made from pine veneer and epoxy adhesive (type PE) had the highest density. Meanwhile, OSB without veneer layer (type K) was at the lowest level (Table 4). The size of pine’s fiber wall was twice thicker than that of mahogany’s (Karlinasari et al., 2010). This was one of the causes why pine had the highest density when compared to the other two wood types. Tsoumis (1991) explained that the wood density values varied due to the fiber wall’s thickness differences. Thick fiber wall with a small lumen had a high density, while thin fiber wall with a thick lumen had a low density. The fiber wall thickness also influenced the stability of wood dimension and moisture content.
| Type | N | Subset | |||
|---|---|---|---|---|---|
| 1 | 2 | 3 | 4 | ||
| K | 5 | .6980 | |||
| MI | 5 | .8560 | |||
| ME | 5 | .9080 | .9080 | ||
| AE | 5 | .9100 | .9100 | ||
| AI | 5 | .9340 | .9340 | ||
| PI | 5 | .9440 | .9440 | ||
| PE | 5 | .9920 | |||
| Significance | 1.000 | .112 | .302 | .089 | |
OSB’s moisture content was 13.41±0.44%, while the average moisture content of those 6 com-ply types (AI, AE, PI, PE, MI, ME) was higher, that was, 13.66±1.01%. This value was classified into high category because JIS standard only required the moisture content of less than 13%. This was due to the measurement made when there was a consistent increase of moisture content after made into com-ply as type PE and ME had KA lower than type K does. The other types had higher MC. The result of ANOVA showed that com-ply type influenced moisture content (Table 3). The further Duncan test showed that com-ply type PI (pine veneer and isocyanate adhesive) had the highest moisture content.
Table 2 showed the value of water absorption (WA), thickness swelling (TS) and linear expansion (LE) of all com-ply types. There was no clear trend shown between com-ply and OSB, which values were, some, bigger and, the others were smaller than type K. Com-ply type PI (pine veneer, isosianat adhesive) had smaller value of OSB and consistent at almost all variables. Although the difference reached 38% on thickness swelling of 24 hours, yet the value was not statistically significant. It was proven by the result of ANOVA which was not significant (Table 3). From eight dimension stabilization indicator variables, only parallel linear expansion statistically influenced when measured after the immersion of two hours. The analytical result of Duncan test showed that this variable made OSB had the biggest value when compared with all com-ply types.
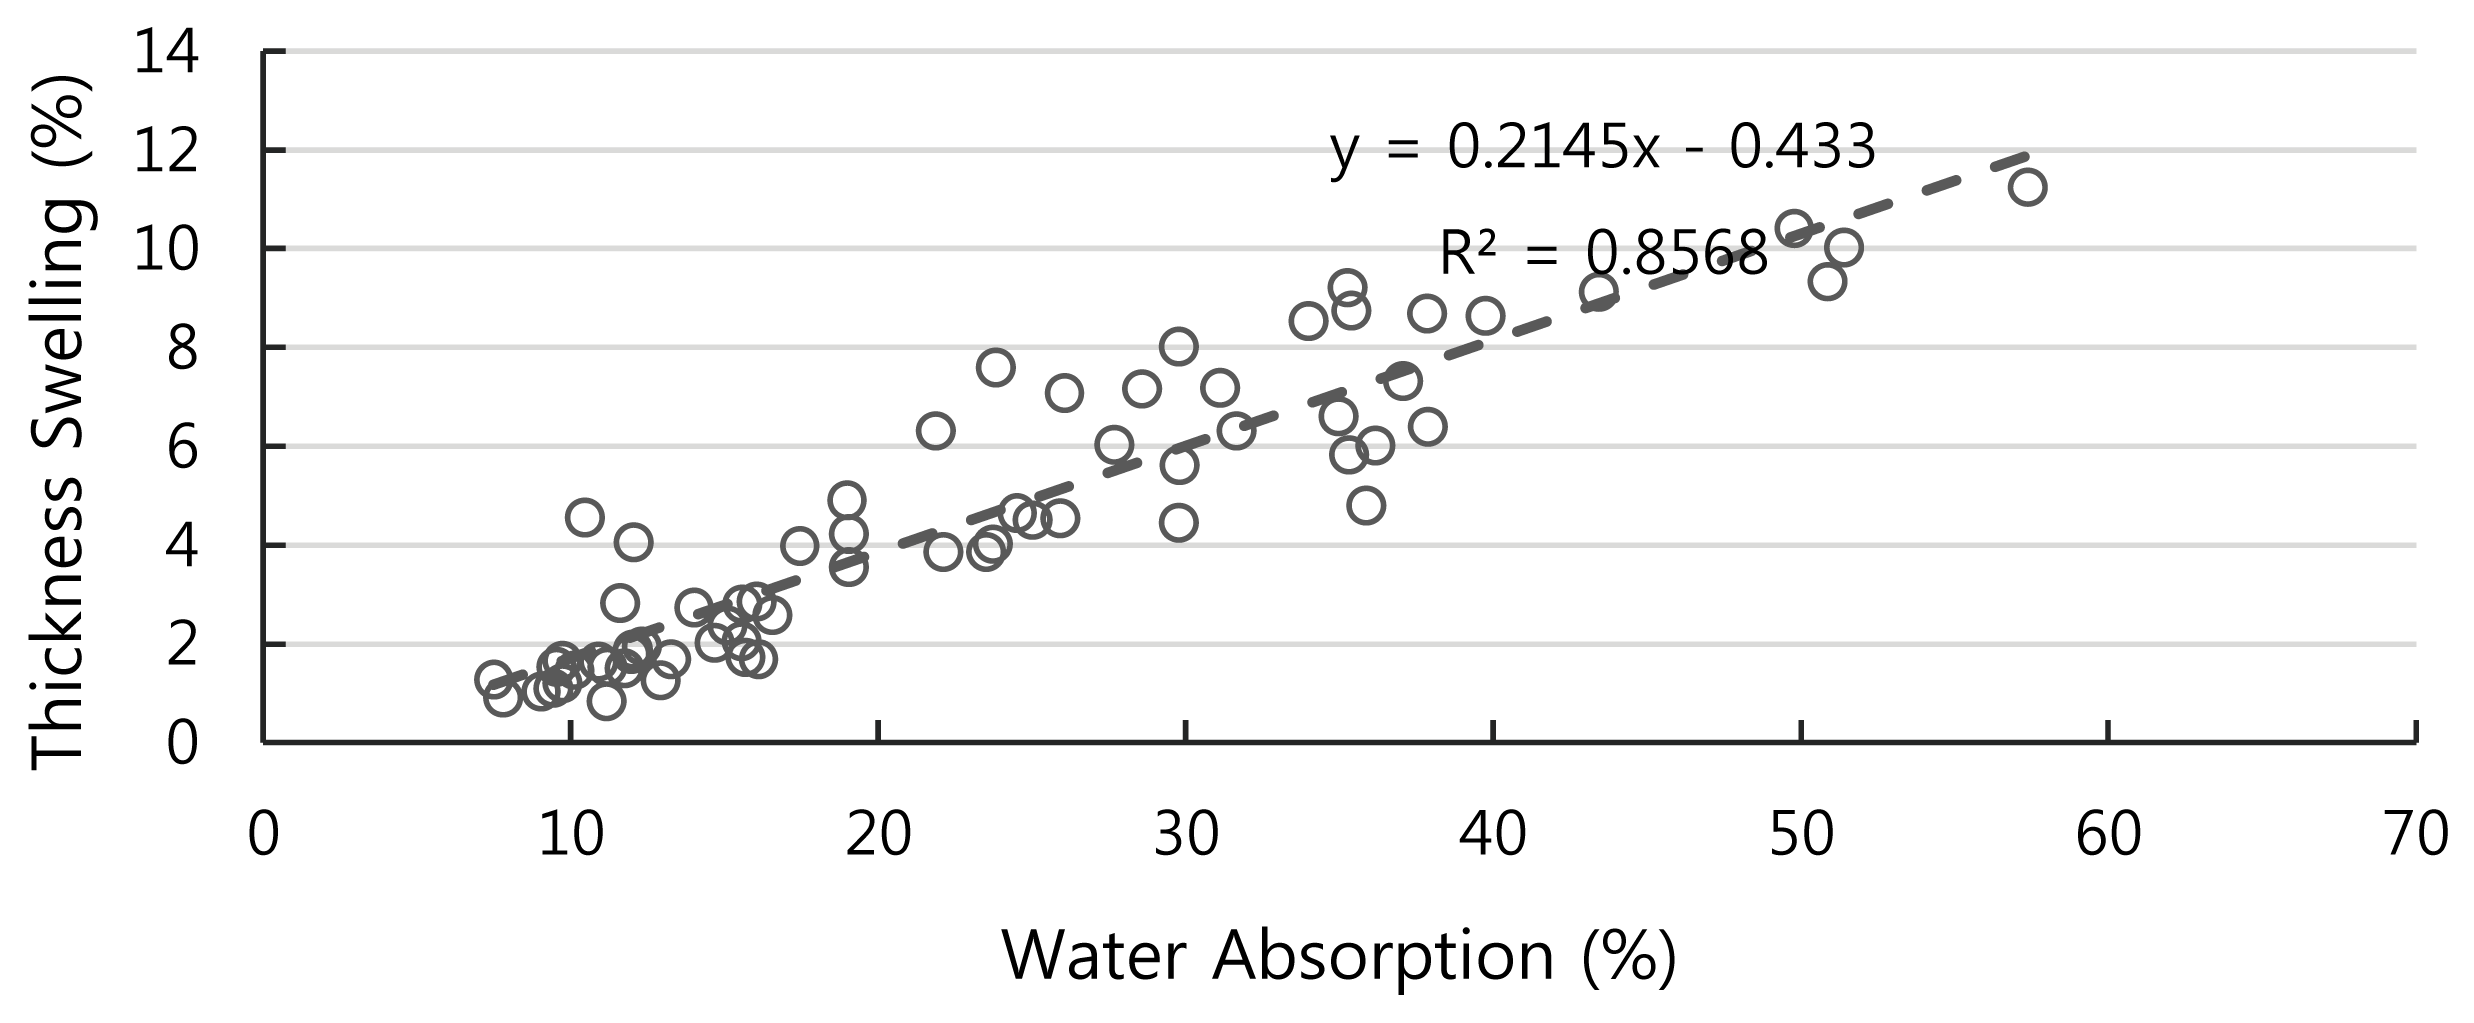
The dimension stabilization indicator was closely related each other due to the addition of panel moisture content which could increase the thickness swelling and linear expansion. The other opinion states that moisture change was one main cause of linear expansion change when compared to the moisture content itself (Wu and Suchsland, 1996). Fig. 2 showed the regression between thickness swelling and water absorption. The undertaking relationship was linear with the formula TS=0.2145WA-0.433. The determination’s coefficient value 0.8568 showed that both variables influence each other. Unlike TS, the relationship between LE and WA was logarithmic with the formula presented in Fig. 3. The determination’s coefficient is 0.6335 for parallel direction and 0.7237 for perpendicular direction. Those values were classified into high category to explain the influence between LE and WA.
Linear expansion with perpendicular direction was more consistent when compared to parallel direction. The difference was shown at the trend line of Fig. 3. This was found in both OSB and com-ply, as well as shown in variables of immersion for 2 hours and 24 hours. The value difference varied from 1% to 62%. The result t test asserted that the value difference between parallel and perpendicular direction with the value of p ≤ 1%. The supporting research result was obtained from that conducted by Wu and Suchsland (1996) stating that LE with perpendicular direction was bigger than that with parallel direction.

The tested mechanical characteristics in this research were flexural properties (MOE, MOR), Screw Hold Power (SHP) and Internal Bonding (IB). Fig. 4 showed the value of flexural properties of all com-ply types. Type K had MOE of 9832±3946 N mm-2. The other com-ply types tended to have smaller values than type K. Moreover, type AI (avocado veneer, isocyanate adhesive) had the difference up to 48% with OSB. Meanwhile, the value of MOR type K was 38±14 N mm-2 and considered relatively low when compared to all com-ply types. The com-ply with the lowest MOR was AI while the highest was PE type (pine veneer, Epoxy adhesive) of 47±10 N mm-2 (23% higher than type K). The result of ANOVA showed that the com-ply type made in this research did not influence the value of flexural properties (Table 5). It showed that this research had found value differences of MOE and MOR between OSB and OSB coated with veneer. However, the difference was not significant.

| Dependent Variable | F | Sig. |
|---|---|---|
| MOE | 1.98 | 0.102 |
| MOR | 0.68 | 0.663 |
| Screw Hold Power | 3.27 | 0.015 |
| Internal Bonding | 0.81 | 0.571 |
The difference in MOE of composite board could be explained using two approaches. First, OSB density and com-ply density. Improving OSB and Com-ply density could improve the flexural properties. Second, different density between face, core and back layers of board (Subiyanto et al., 2008). Coating surface with materials with higher density could potentially improve board’s MOE value (Biblis; Grigoriou and Carino, 1996; Sugiri et al., 2016). However, if the surface layer had lower MOE value than that of OSB, the effect was likely to be the opposite. The research result showed that MOE improvement as presented in Fig. 4 seemed to take place only because of difference in adhesive and type of veneer, but was not identical to a density improvement of com-ply as a whole. This confirmed that addition of veneer layer improves density, but the bending strength was determined by the MOE of veneer layer.
The Oriented Strand Board from sentang wood (Melia Excelsa Jack) (density = 0.58-0.6 g cm-3) explained by Iswanto et al. (2010) has MOE and MOR of 60100 kg cm-2 and 440 kg cm-2 respectively. The research conducted by Cahyono et al. (2014) states that Bamboo Composite Beam (Specific Gravity= 0.71) had the value of MOE and MOR of 7.93 GPa and 41.3 MPa respectively. When compared to some previous researches, the MOE and MOR values presented in Fig. 4 showed that this product could be potentially used to improve OSB appearance and its mechanical properties.
Com-ply is commonly used as a construction material and furniture complementary. Thus, in its utilization, com-ply will be assembled with the other materials. Celebi and Kilic (2007) stated that screw was the most frequently used material in its assembly. Data of screw hold power (SHP) were necessary to be presented in this research to support the objective. The OSB’s and com-ply’s Screw Hold Powers were presented in Fig. 5. The average OSB’s SHP was 789 N with the deviation standard of 57 N. Two com-ply types with the average of under OSB average included type PE and AI respectively by 680±139 N cm-2 and 751±111 N. The result of ANOVA showed that com-ply type influenced SHP (Table 6). The result of further Duncan test showed that com-ply type AE and ME rank the highest. Both types’ SHP value increased of 20-23% compared to type K. This result also indicated that avocado and mahogany veneer, could not only change the OSB’s appearance, but also had the potential to increase SHP.

| Type | N | Subset | ||
|---|---|---|---|---|
| 1 | 2 | 3 | ||
| PE | 5 | 51.0880 | ||
| AI | 5 | 56.4460 | 56.4460 | |
| K | 5 | 59.2777 | 59.2777 | 59.2777 |
| PI | 5 | 60.3720 | 60.3720 | 60.3720 |
| MI | 5 | 68.5160 | 68.5160 | |
| ME | 5 | 71.5700 | ||
| AE | 5 | 72.5300 | ||
| Sig. | .209 | .104 | .081 | |
The previous research concerning on OSB’s SHP had been conducted by Ibrahim and Febrianto (2013). The highest SHP value presented was 70.83 kg cm-2, while the smallest was 40.9 kg cm-2. Meanwhile, for veneer-based products, LVL poplar (veneer of 5 mm, 10 layers) had the highest SHP by 87226 kg cm-2 (Celebi and Kilic, 2007). The difference of both SHP values was greatly significant due to the different method and material used. This explanation was only used as the comparison to SHP Com-ply which OSB and veneer part were combined in one product. The difference of SHP value was influenced by the tree type which material, moisture content, orientation of grains and sections, specific gravity, rising duration, nailing method and surface smoothness are produced (Soltis, 1999).
The com-ply’s average Internal bonding (IB) was 0.35 N mm-2 with the deviation standard of 0.12 N mm-2. The value of IB OSB was 0.42±0.14 N mm-2. The com-ply type PI had the lowest IB value of 0.29±0.09 N mm-2 (Fig. 6). The result of ANOVA showed that com-ply type did not influence IB. This was because when testing IB, the damaging part was the middle part consisting of OSB with similar characteristics.

The internal bonding of pine’s OSB presented by Cloutier et al. (2007) was 6.79±1.52 kg cm-2 and 5.42±1.02 kg cm-2 respectively for the strand radial and tangential direction. The Oriented Strand Board from Africa wood (Maesopsis eminii) and Akasia (Acacia mangium) was approximately between 3.94- 7.01 kg cm-2 (Nurhaida et al., 2008). Furthermore, for Bamboo’s OSB, Febrianto et al. (2012) state that the average IB was approximately between 5.41-7.28 kg cm-2. Based on some aforementioned IB values, the IB presented in Table 6 had lower value. However, when compared to the required standard, the minimum IB was 0.3 N mm-2, that all OSB and com-ply in this research met to JIS A 5908-2003 standard.
4. CONCLUSION
The conclusion may be drawn from this research is as follows:
Layer addition on both OSB surfaces using pine, avocado and mahogany veneer increased the density of com-ply at approximately 22-28%.
Veneer coating was proven increasing com-ply’s dimensional stability, including the Parallel Linear Expansion value during the two-hour immersion.
Parallel Linear expansion was smaller when compared to the perpendicular. The value different was approximately 1-62%.
Com-ply PE type (pine veneer, Epoxy adhesive) had MOR value 23% higher than that of OSB. An improvement of MOE was also found as the result of veneer coating and adhesive addition, although it was statistically insignificant.
Com-ply type AE (avocado veneer, epoxy adhesive) had the highest value of screw hold power.